As with all software, a good understanding of the program's functions will help you get the best out of what is a very sophisticated product. Please understand not all users will have all these options available, as a few of the options will depend on the package you have, and some may need to be requested and switched on at the server — but most of what you see here is available on our most basic package for both boat and vehicle customers.
This help file is not meant to be a step by step guide to the product; it is more a device to steer you in the right direction and help you experiment. It does, however, assume a basic understanding of how to use computer programs.
Caution: as mentioned above, these instructions are based on someone with administrator privileges — not all the options or adjustments are available to all users, and some menu displays will look slightly different. Also, all the controls and screens mentioned assume you are using the full-size (PC) version, not the smaller smart-phone option. Remember, if you are struggling to understand something please email us for help — like all help-desks, we are always happy to help a customer who has at least tried to 'RTFM'.
GPS Help Files Index
Click a link below to go straight to that entry
Log On
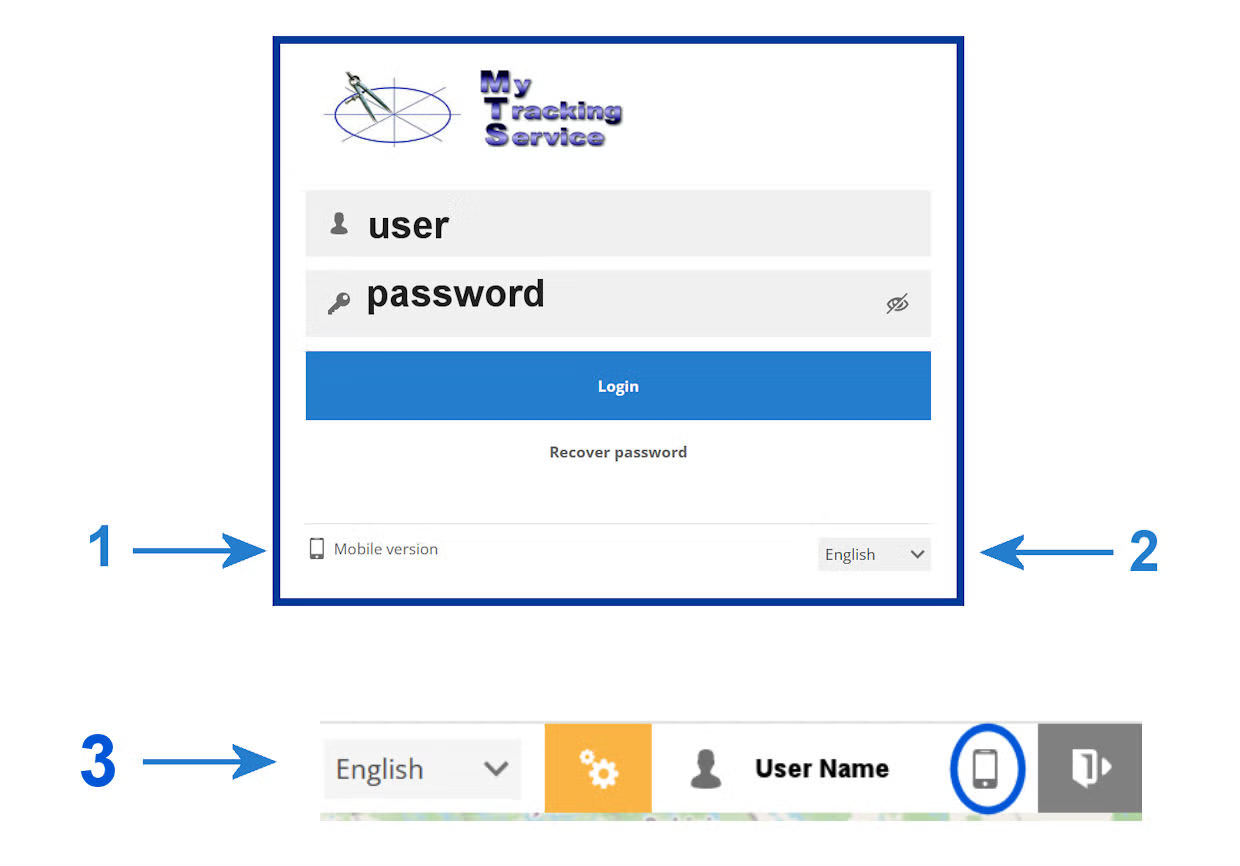
To log on, please go to map.mtsltd.com. In the unlikely event it takes you to the demo map, just log out of that (top right corner of the map on a PC, in the menu on a phone) and try logging in again. The empty log-in screen is shown below. Next, fill in your username and password, with no space at the start or end of your entry.
If you are logging in on a small screen like a smart-phone, select "Mobile Version" (bottom left of the log-in screen, shown as 1). You can also access other languages (shown as 2). Note: you can also switch to the phone screen while inside the full-size program, by clicking the phone symbol at the top right of the map screen (3 below).
However, we strongly recommend you practise getting used to the program's features on a full-size computer screen, at least until you understand the program's options better.
An Overview of the PC's Workspace
Before we get down to detail, here is a quick overview of what the work area looks like when viewed on a normal-size screen such as a PC or tablet, and a brief explanation of the major controls.
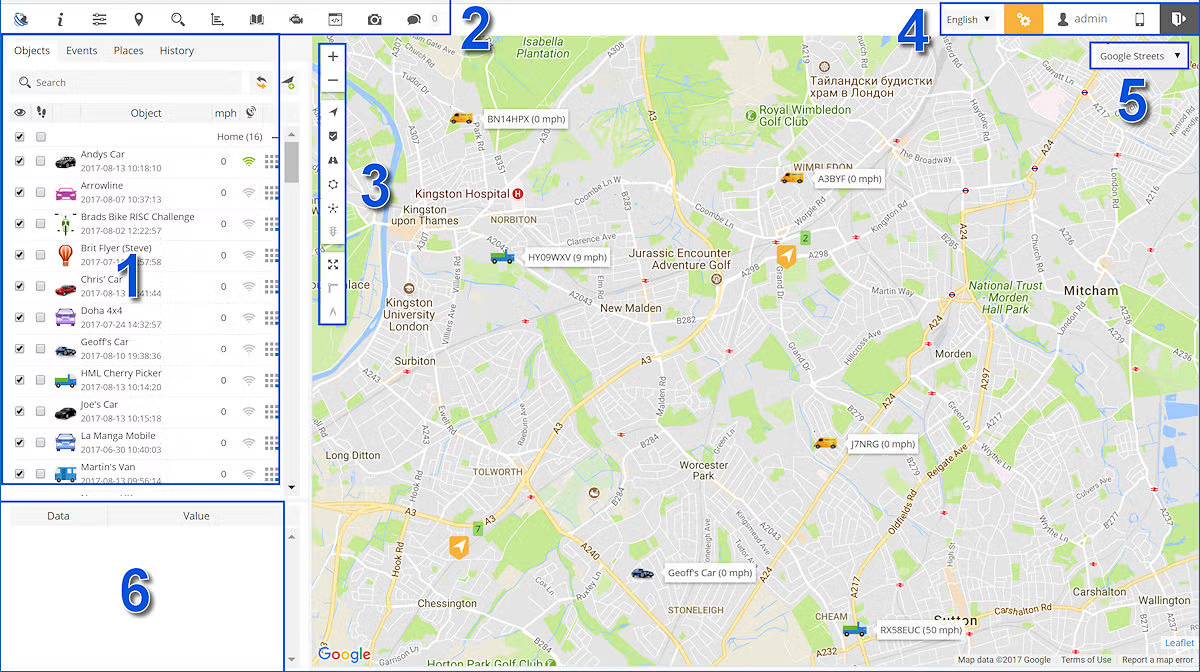
- This is where your objects (cars, trucks, boats, aeroplanes, etc.) are displayed. Users may have one or more objects in this area, which may be exclusively theirs or shared objects depending on their package.
- This area provides access to: Help, Settings, Show point, Search address, Reports, Logbook, DTC, Object control, Image gallery and Chat. (Some items may not be available to all users.)
- Map-related controls in order: map zoom control; enable/disable object visibility; enable/disable marker visibility; enable/disable route visibility; enable/disable zone visibility; clusters control (split markers and objects into groups for users with a large number of objects); live traffic information when using Google Maps; fit objects on to map; straight-line distance measure; measure area.
- Account panel, where you can select available languages, change to phone view, or log out.
- Map type selection (Google, Bing, Roads, Satellite, etc.)
- If you click on an object, its last fix information will be shown here.
An Overview of the Smart-phone's Workspace
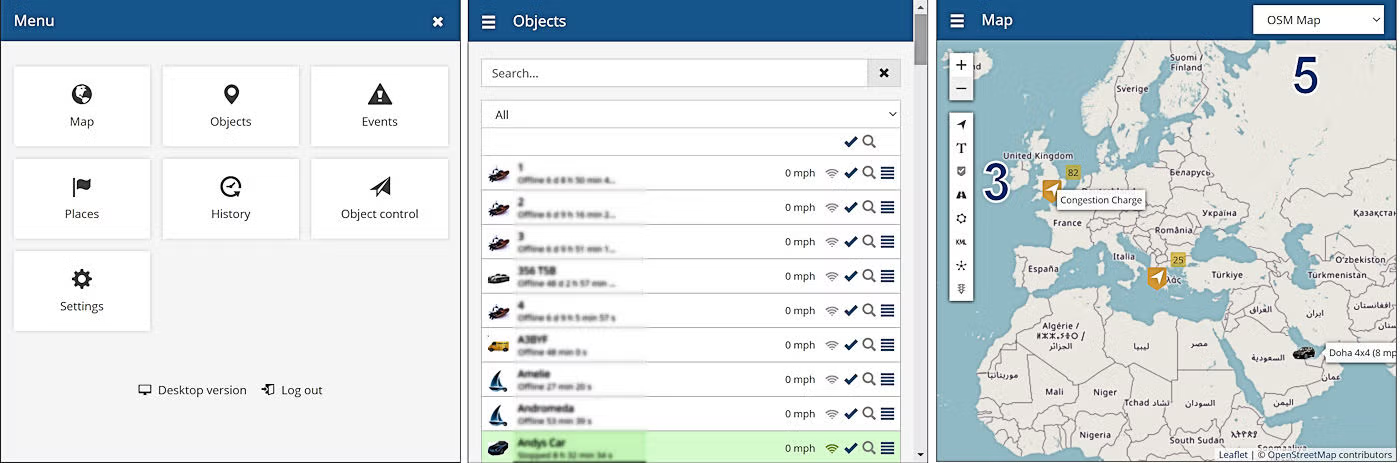
Here again is a quick overview of what the work area looks like when using a small screen such as a smart-phone, and a brief explanation of the major controls. Above shows the three main screens you will use on a phone. You can configure the screen to start on any of those shown above, or the last used screen. On the "menu" screen you have slightly fewer options than on the PC's main screen, but the major difference is there isn't enough screen size to show both "objects" and the "map". However, once you have selected the object of interest, it takes you to it on the map. Options 3 and 5 are the same as above, and of course clicking on the menu symbol (three bars, sometimes called a hamburger) will take you back to the main menu.
The PC Workspace in More Detail
All that follows assumes you are using a PC's full-size screen, not the much smaller and limited phone screen. Once you have logged into your screen, you will see a page like that partially reproduced below. If you are not already on it, click the Objects Tab in the top left-hand corner of the screen. You will then see all the objects in your group (an object is anything you are monitoring, be it boat, car, caravan and so on, and you may have only one or several depending on your package). Next to your object's icon will be a couple of tick-boxes: if you have several objects in your group, one lets you hide and show an object in the group, and the other lets you follow an object as it moves across the map. Clicking on the object's name will centre the map on that object; clicking on the actual icon will do the same, but it will also zoom in on its location.
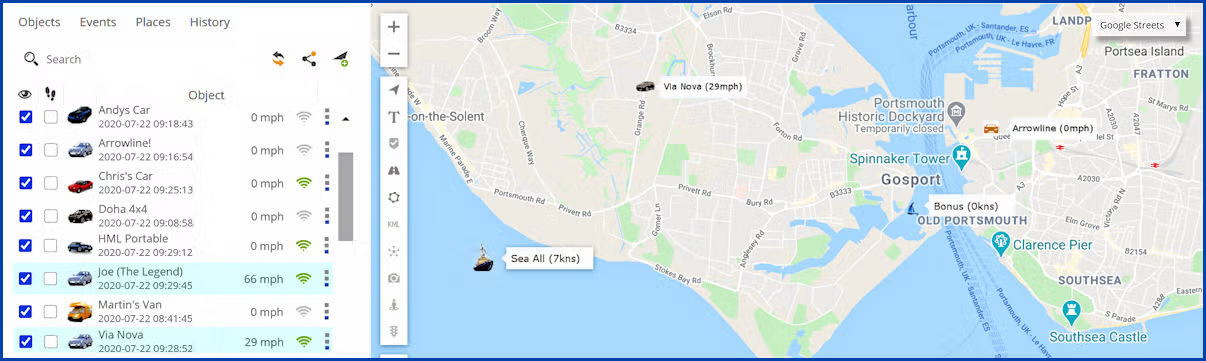
The type of map used can be selected from the drop-down menu in the top right of the map screen. In the example image above, "Google Street Maps" has been selected, but boat owners may want to use the Bing, or Google "Satellite" view. Please feel free to experiment to see which map best suits your needs. You can manually zoom in and out of the map with the plus and minus signs; you should also find your mouse wheel (if fitted) will also work for zooming. You can also hold down the left mouse button to drag the map.
Back in the object box you can see the date and time of the last update from the object; you can also see its approximate speed. Next to that is a radio symbol which, if green, indicates the object is logged into the map screen (don't worry if it isn't green at that moment, as this will come and go depending on many factors, such as whether it's time to transmit).
 Grey icon – Not connected (asleep)
 Orange icon – Online but no GPS signal
 Green icon – Online and good signal
With some packages the object's strip may also change colour to highlight objects that are moving, as shown above with Joe and Via Nova. The last column is a quick-access, or short-cut, menu, with some commonly used options that are also available from the main menu.
Below the plus and minus signs you will find some other symbols for different options that you may find useful if, for example, you are a fleet operator. The first (arrowhead) switches the object icons on and off. Beneath it is the ability to switch "Map Markers" on and off. Next is the routing ability, and then the ability to switch zones on or off. Next is Clusters (some fleet operators who have a large number of objects may split them into groups, which according to map zoom level will reveal content). The last icon only works with Google Road Maps and allows you to see live traffic information – very useful if you are tracking a road vehicle. Feel free to experiment with the different map views to see which you like; as explained above, some marine users may prefer to use the satellite view option. Referring back to the top image, you will see that next to the Object tab you also have "Events", "Places" and "History".
Events Tab: the Events tab allows users to set up events, which may trigger when an object enters or leaves an area, or when a speed is exceeded, and so on. You can set this up by going to "Events" in the Settings menu (see image below). However, it is important to remember there are many report options offered (like the ability to say if the GPS aerial lead has been cut), but they will only work if the unit fitted in your object has that ability built in (which most units do not have as standard).
Example of an Event: we think the best way to learn is to play, so here is a quick example — further down these pages we will set up a couple of events in more detail, as these are a very useful tool that users can adapt.
In brief, if you go into Settings and then Events, click the plus sign (image A below) to create an event. Now in the new box (B) give this a name, say "Fred is speeding". Now select Activate and Over-speed, and set the speed to say 60mph. Now click on the Notification Tab and, on the new screen (C), select "System message" for this event to pop up on this computer. Try a sound as well, if your computer has a speaker. If you have paid extra to have the SMS or email options, then you will have had that set up for you — if not, ignore it and just go to the Objects Tab. On this screen, apply it to your object (or if you have more than one, select as many as you want) and, most importantly, click Save.
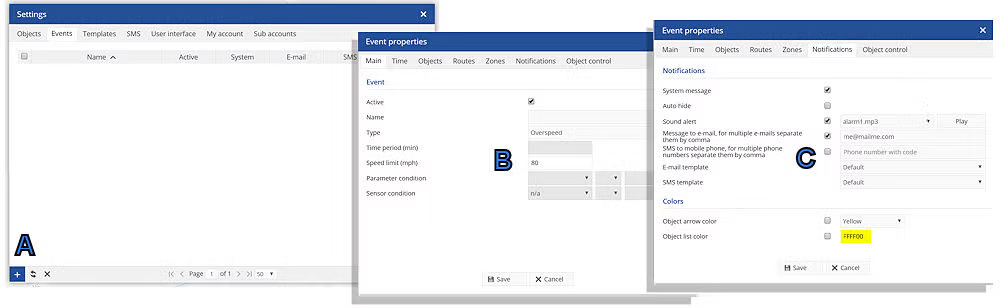
If you have done it right, you will now get a noise and a screen notification each time Fred goes over sixty. Once you have finished playing, go into the Events Tab in Settings and click on the dustbin symbol to delete this event. Note: this area is explained in more detail further on.
Geo-fencing
Standard account customers have the ability to ring-fence (put a zone on the map) so that when your object leaves or enters that zone it will trigger an event, in the same way as the example above.
Going back to the second screen above, you can see there is a tab called Places Tab (next to the Objects and Events tabs). This is a tab most customers probably won't use straight away, but again, if you want to have a play, you are unlikely to come to any harm. The first thing you will see is you can add places (markers) to the map, for example your home base. You can also edit, refresh and delete the markers from here.
There is also a useful option in this section called Zones, which is ideal for setting up a geo-fence. To use this, click on the Zones tab and then the "add zone" icon (note: with all the icons, just leaving your mouse over them will tell you what they do). Give the zone a name and then draw it on the map — it isn't easy to see how to do at first, but play with it until you get it right (and if you don't, just click Cancel and start again). One important note: there is a software limit to the number of points used to make up a zone, which is forty of the large white dots you can see in one of the images below. Double-click when done, and save it. You can now use it in events (see above) to do something when someone leaves or enters that zone, the same as you did with Fred's speed.
Below are two examples of the sort of zones you could create, and things you could do with them. The first is the London Congestion Charge Zone, and can be set to trigger a warning if one of your objects enters the area. The other is a zone drawn around the Isle of Wight that could warn you if an object left the island, or the waters around it. (Has anyone else noticed the similarity of the two shapes?)
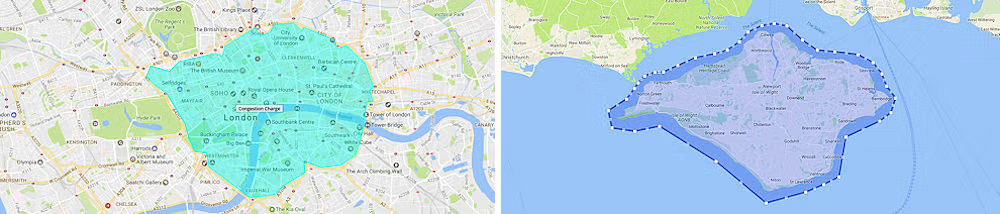
Remember to set up an event based on the zone you have just drawn — refer to the section above, Events Tab, only this time set the event to be triggered when an object leaves or enters a zone (more about events further down the page).
The next tab is the History Tab, and it is here you can run just about any report you could ever want! The most common use is to play back an object's route from the past few weeks. The system will store location data for up to 12 weeks, and you can always save a report to view at any time in the future. First you need to select the object (if you have more than one). Then you can select a time span from the "Filter" option, or manually set one from the built-in calendar.
Example of a "History" Report (note: for text reports, see further down the page): in the example below we have selected our Doha-based agent on the 24th of November 2016, from 11am to midnight, and decided that a stop will be defined as stationary for more than 10 minutes. The result is shown on the map and reproduced below. If you put a tick in the "Data Points" box, it will show the route as a series of joined-up dots. Clicking on any dot will tell you the time, speed, etc., at which the object arrived at that point.
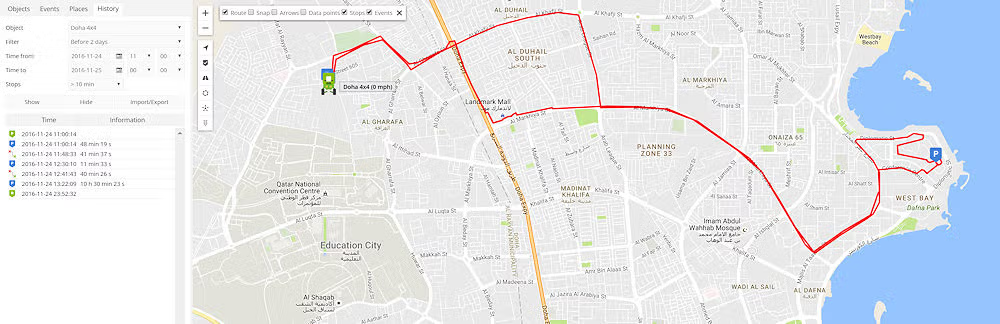
On the left of the image you can see a brief summary of the journey, showing how long the vehicle took to travel each stage, and the time parked. Not shown in the above image is a playback button (it's off the bottom of this image), which will actually show the vehicle driving across the map at scaled speed. There are many other things you can play around with, including a graph of the object's speed during the trip. You can also export the report in a number of formats, including spreadsheet (CSV) and, most importantly, GSR format. If you save a report in GSR format, you can re-import it at any time and replay it over and over again (see more information below).
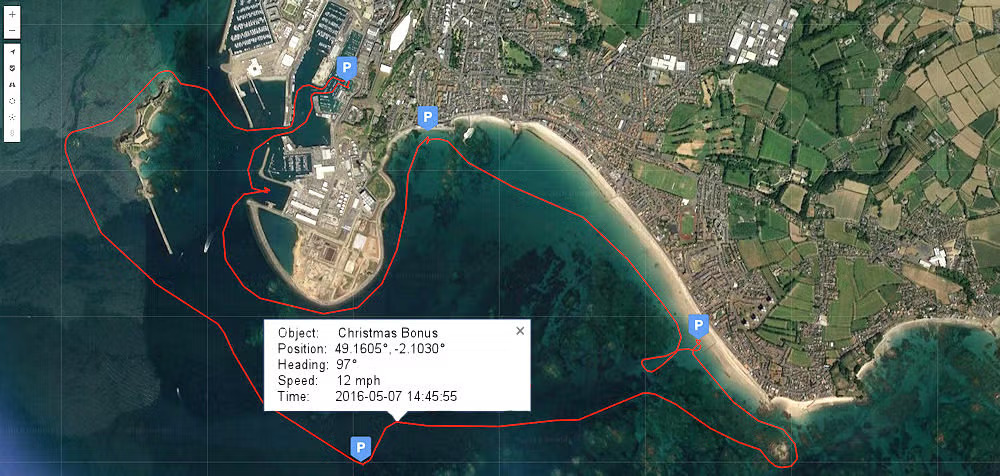
Above can be seen a close-up of another report, this time one of our customers having fun with his Jet Ski south of St Helier Port, Jersey. In this example, one of the satellite view maps has been chosen as a background reference. The "P" indicates the location where the object was parked for more than a predetermined number of minutes (which you can set when configuring the report). By clicking on any of the "Data Points" that make up the route display, a box will appear, like the one in the picture, showing full details about the object at that point in its journey. Again, the report, although shown as a screen display here, could be saved in GSR format (see below) and re-imported at any time in the future.
Exporting / Importing Graphic Reports: as mentioned above, you can export the report in a number of formats, including spreadsheet (CSV) and, most importantly, GSR format. If you save a report in GSR format, you can re-import it at any time and replay it over and over again. To try this yourself, go to the "History" tab and run a standard report on one of your objects for the last week. Run the report and make sure it gives you what you want. If it's right, select the "Import/Export" tab, export the report in GSR format, and then clear the map screen with the "Hide" tab. Now go back to the "Import/Export" tab and select "Load GSR" — you'll be prompted to find the file on your hard drive (by default it should be saved in your computer's "Downloads" folder). Once reloaded, you will see all the information you had before. This means you can keep reports for as many years as you want, unlike our system, which only stores the information for a couple of months.
A Simple History Trip Report
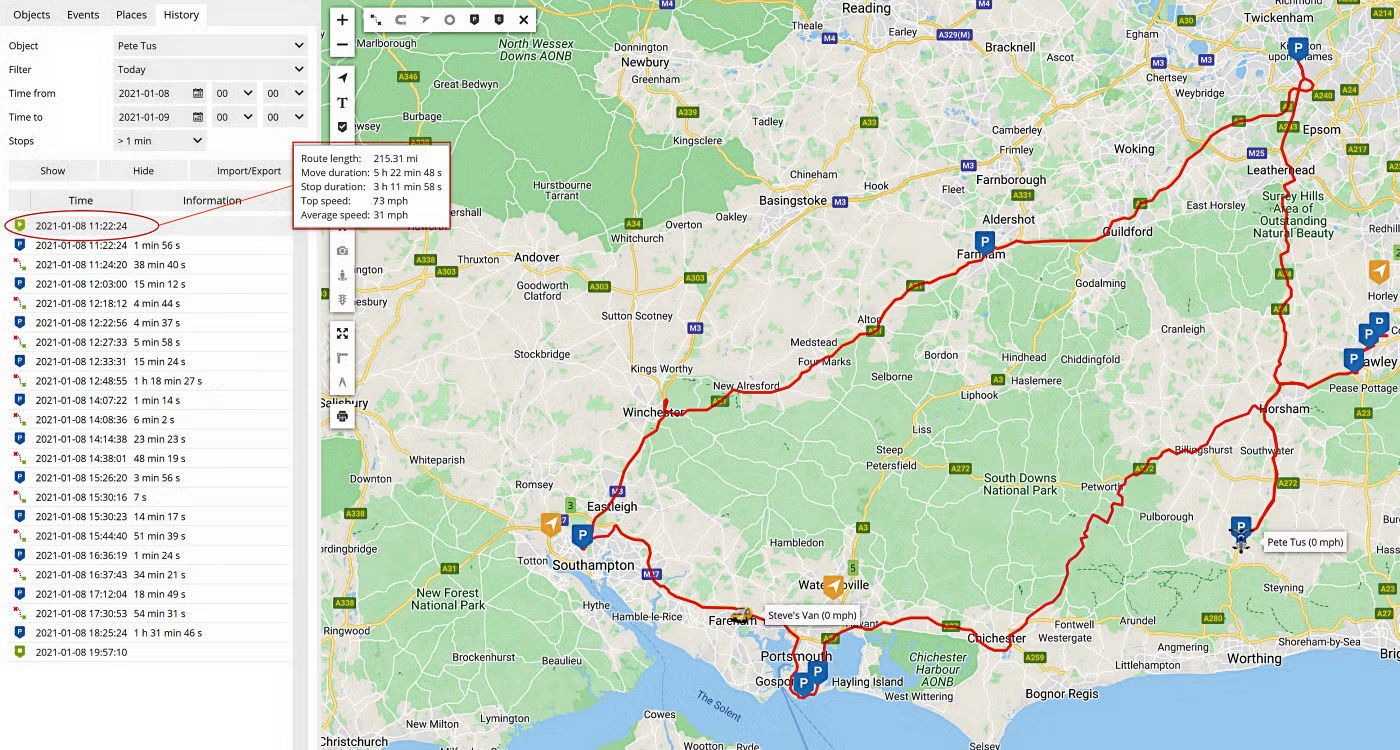
Most users will, from time to time, wish to pull up a quick and simple report about a journey or voyage that has been completed, or is even only part-completed. The things you may be interested in could include distance/mileage, travelling time, top speed, etc. There is a very simple way to do this — just go into History and run a report for the time of interest. In the example below the journey took all day, so the report has been run for that. You will notice that if you simply hover your mouse over the start, or end, entry, a box will pop up with a summary. You can also hover over an individual entry to get information on that part of the trip.
Regular Text Reports
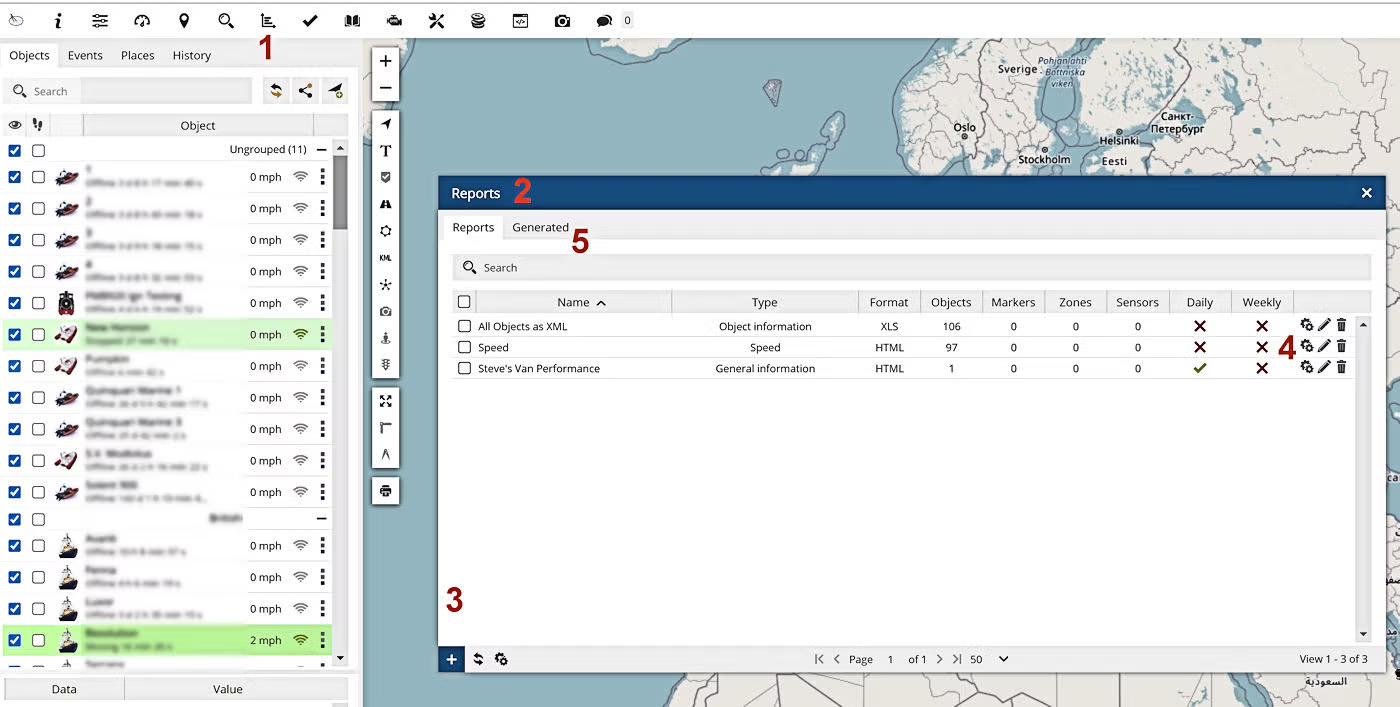
If you need to run a report on a regular basis, you may want to create a "master report". To do this, click on the report symbol (number 1 above, looks like a spreadsheet, or a graph with two arrows). This will give you the Report Wizard, as in number 2 above. Click the plus sign on the new menu to create it (number 3). This will bring up what at first glance is a complicated screen with a huge range of options to select from — the best way to understand them all is to create a report, run it, and see what you get. If it isn't what you want, try something else.
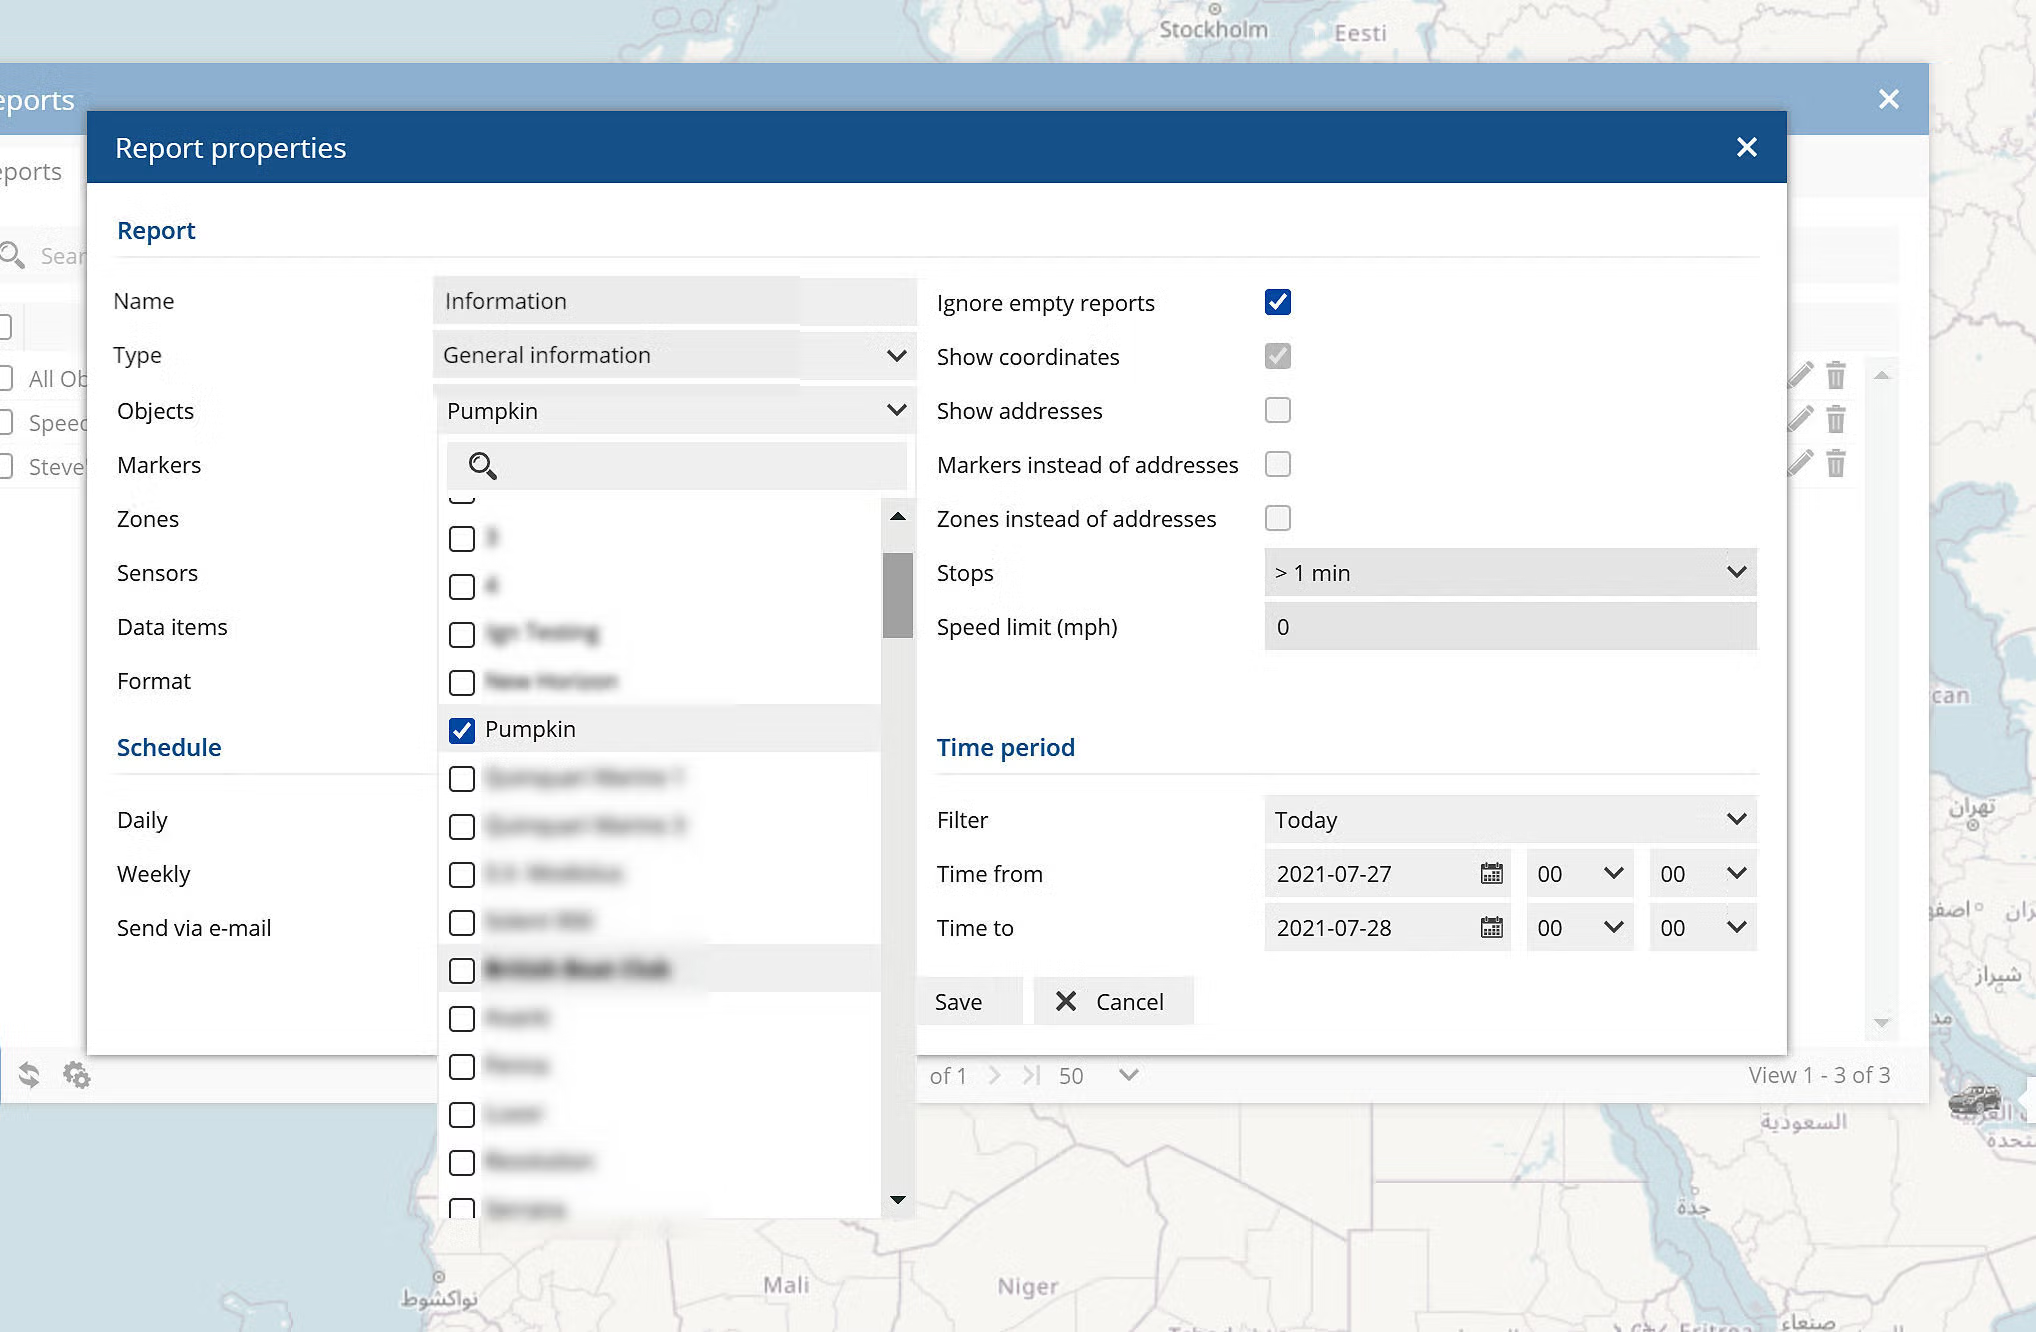
To get started, we'll set up a general report and just run it on one object — a boat called Pumpkin. This will let us see how long it operated for today and what its top speed was. First give the report a name, then select the type — in this case, General Information. Next select the object, which can be any or all of the objects you monitor. That's enough for now, but as you can see elsewhere on the screen there are many rules you can apply, including only allowing the report to run on certain days (in the case of an employer who lets staff do private mileage at weekends), and so on. We'll run this report manually here, but you can see there are options to run it daily or weekly and then send it by email.
If you now click "Save", you will return to the screen shown in the image above this one, where your report will appear. Whenever you wish to run it, just click on the "gearwheels" symbol (number 4 in that image) and you will get a report like this:
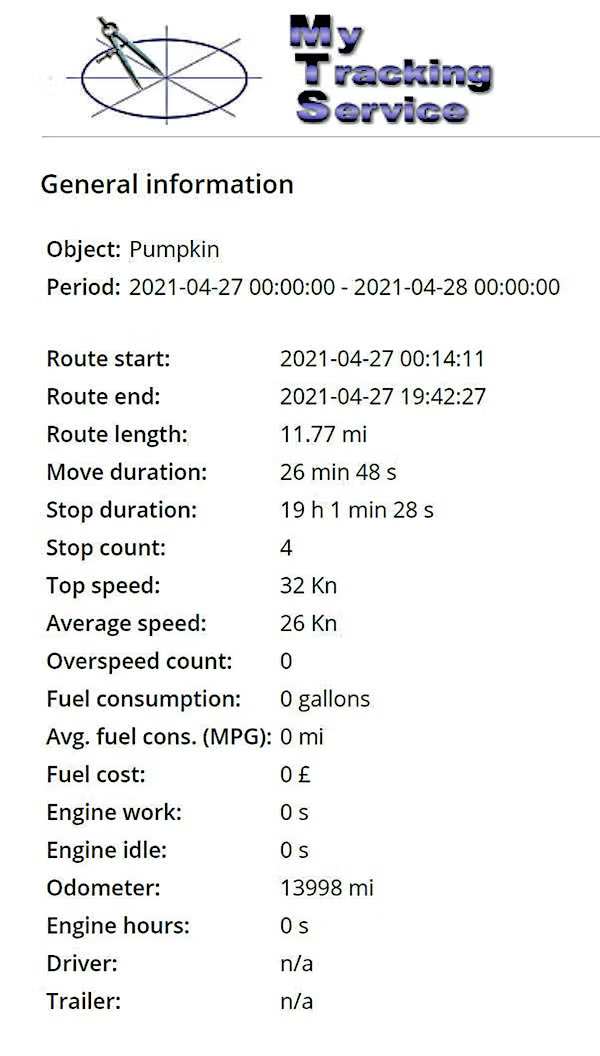
So now you have the basic idea, let's do another report — say, for a delivery van. Once again, create a report with the plus sign (number 3 above), give it a name, and select the "Drives and Stops" option in "Type". Now select which object you're going to report on, and set "Stops" to something realistic for your needs (say, 5 minutes). Leave the "Schedule" boxes for now.
Now you need to define the "Time Period" — let's say, for this example, you want the report for last week, so select "Last week". Lastly, select your preferred format (HTML will do for now) and click Generate. This should download an HTML (web page) report to view in your browser. If this is what you want, give the report a name and save it for future use. If not, go back and try different options — but remember these reports are largely text, not graphic reports.
Scheduled Text Reports: once you have a report working how you want it, you can tell the system when to run it and which email address to send it to. The options are:
Daily – the report is sent daily for the previous day.
Weekly – the report is sent weekly, every Monday, for the previous week.
Send to e-mail – where you enter the email address(es) to send your reports to (you can use multiple addresses if separated by a comma).
Notes:
All these text reports are stored under the "Generated" tab (number 5 in the image above) for a few weeks.
If you're having them emailed, we suggest the PDF format is best, because you can store them and easily print them off.
About Time and Date
The entire world uses Coordinated Universal Time, or UTC (GMT if you're British), as the base for its timing, and satellites are set to follow that. If this is inconvenient for you, there are a number of things you can do, but the quickest and easiest solution is to go to the Settings icon (3rd icon in the top right – looks like a graphic equaliser) and select the "User Interface" tab. Scroll down to the bottom, where you can offset the time by whatever you want, depending on where in the world your tracking device is working. If you want to go a stage further, tick the box underneath for DST and enter the dates the clocks go back and forward. The system will then adjust this automatically for you.
Often connected to the above is a problem where you run reports for the last hour and get nothing back. To resolve this, please take the following steps:
1. Check your computer's time is correct.
2. Log on to the map program using your normal username and password.
3. Go to "Settings" (looks like a graphic equaliser, top left).
4. Select the "User Interface" tab and scroll all the way to the bottom.
5. In "Time Zone", enter the correct time for your time zone, e.g. UK "UTC 00:00", Doha "UTC +3:00", and so on.
Now you have to decide: do you want everything to be at that time all year round? If so, save and exit (don't forget to save).
If, however, you want it to take daylight saving time into consideration, tick the box below and select the dates for DST that year, and then the time difference. Note: doing this may throw any reports out until the system has caught up with the changes (usually after a couple of fixes have come in from a unit). Now save and exit (don't forget to save).
More About The Top Bar

The top of the page has other symbols, shown above. These are, from left to right: About – tells you the software version. Help – a link to this page. Settings – where you can change things; this will be looked at in greater detail next (note: depending on your package, some options may not be changeable). Map size – adjusts the map to show all your objects at once. Ruler – gives you a rough idea of "as the crow flies" distance. Show – lets you go to pre-entered coordinates. Search – lets you find locations, like towns, villages, organisations, etc. Reports – lets you run reports. RFID, Objects, Image and Chat all have separate help files, if that service is available in your package. At the top right of the screen you'll also see a telephone icon – clicking this switches the whole program to be optimised for a smart-phone screen. Use this option when viewing on a small-screen device.
If you enter Settings (third icon at the top of the page) and select the "Objects Tab", you will see an entry for all the objects you can monitor (there may be one, or many). Click on the edit symbol (pencil) and you will see a screen like one of those below. It is here you make adjustments to your objects. Start with Main, and you will see its given name, which you can change. Next is your unit's unique identity, then you can add the type of vehicle/vessel, followed by its identification number and registration number — you can leave these blank if you want. Group is next, for those who have many vehicles and want to put them into groups (you must first have defined the groups in the Groups section under Settings). Next is Driver, which, like Groups, requires you to have first defined your drivers in the Drivers section under Settings. Next is Trailers, and that follows the same pattern as the last two. The next two, GPS Device and SIM, are best left alone, or the unit may no longer function — and we will get very, very cross with you!
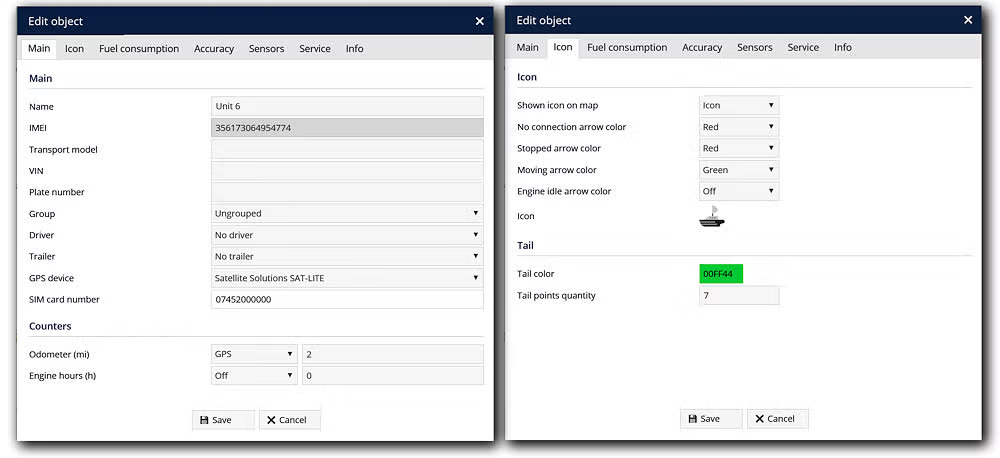
The last options on this page give you a rough idea of distance travelled and hours with the engine running. The mileage figure works on the distance the unit has moved, and its accuracy depends greatly on how it's used. For example, in a city a vehicle can travel 20 miles across town, but the unit may say 18, because that is the total of the "as the crow flies" miles it has measured. If, however, you are going straight up a motorway like the M40, it will be more accurate. Likewise, a sailing boat will be less accurate than a power boat, because of tacking over the course. The "engine hours" figure will only work if your unit is connected to the ignition.
The next tab in Edit Objects is the "Icon" one; here you can select how the object is shown on the screen — it can be an arrow or an icon. If you select an arrow, you can configure different colours for moving and stopped states, etc. Clicking on the icon itself will take you to a new screen where you can select from around 80 icons — you can even make your own and upload them to the Custom Icon page. You may have noticed that when your object moves it leaves a tail to show its direction; on this page you can adjust the length of the tail and its colour. After changing any of these settings, don't forget to save. Hint: see also the section below on how to use the arrow rather than the icon.
The next tab is Fuel Consumption, which gives you a rough idea of how much fuel you are using. Select the measurement unit (KM/MPG) and enter the cost:
- Cost per Gallon / Litre – enter the cost.
- Summer rate per 100 miles/km – enter the amount of fuel your vehicle consumes per 100 miles/km during the summer period.
- Winter rate per 100 miles/km – enter the amount of fuel your vehicle consumes per 100 miles/km during the winter period.
- Winter from, Winter to – four boxes where you set the beginning and end of the winter period.
Arrow or Icon: as mentioned above, it is possible to use either an arrow or an icon to represent your unit. By default most people use the icon, but let's look at what you can do if you change it for an arrow.
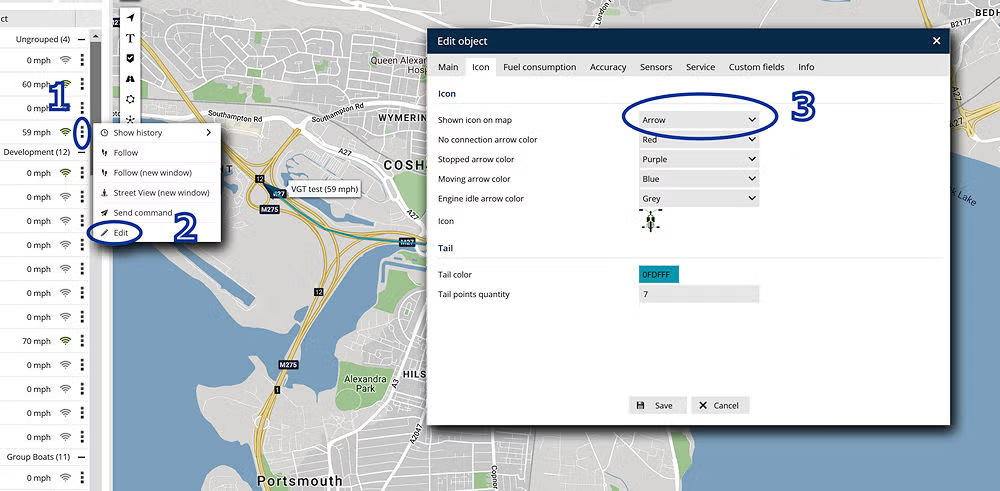
From the Objects section, select the object you want to change (1) and then, on the sub-menu, select Edit (2). Now change the selection from Icon to Arrow (3). Below the selection box you have the option to use different colours for different conditions. For example, when there is no connection to the network (sleep mode or out of coverage), it can show red. When the unit is stationary, it can change the arrow to another colour. If, as in the example above, you set the arrow to blue when moving, you can see at a glance when the unit is under way; you can even show a tail showing where the unit has come from — in this case, green. The length of the tail is set in "Tail Points", the last item on this options menu. Also notice that, unlike the icon, which never changes direction, the arrow always points in the direction of travel.
Understanding the Accuracy of Route
We all want an accurate trace of our journey, including the route taken, so let's talk about how you can achieve this with our system. The traditional way all standard tracking devices work is to report in at set time intervals — in most cases something like every 120 seconds when moving and every hour when not. Clearly the hourly update is "of interest" because it lets you know your vehicle was where you left it (up to an hour ago).
Once it's moving, however, more updates are needed — for an articulated vehicle trundling up a motorway, or a large schooner crossing from England to France, putting a marker on the map every 120 seconds may well be all you need. If, however, it's a service van with the driver on the phone to you wanting directions to a pick-up, or a powerboat avoiding rocks, then something extra is needed. All of our professional systems take it further in this way: we still use timed updates, but we also send an extra one when the angle of travel changes by a preset number of degrees. We also look at speed, and if there's rapid acceleration we send another extra fix. Lastly, we can send a further update when a certain distance is covered.
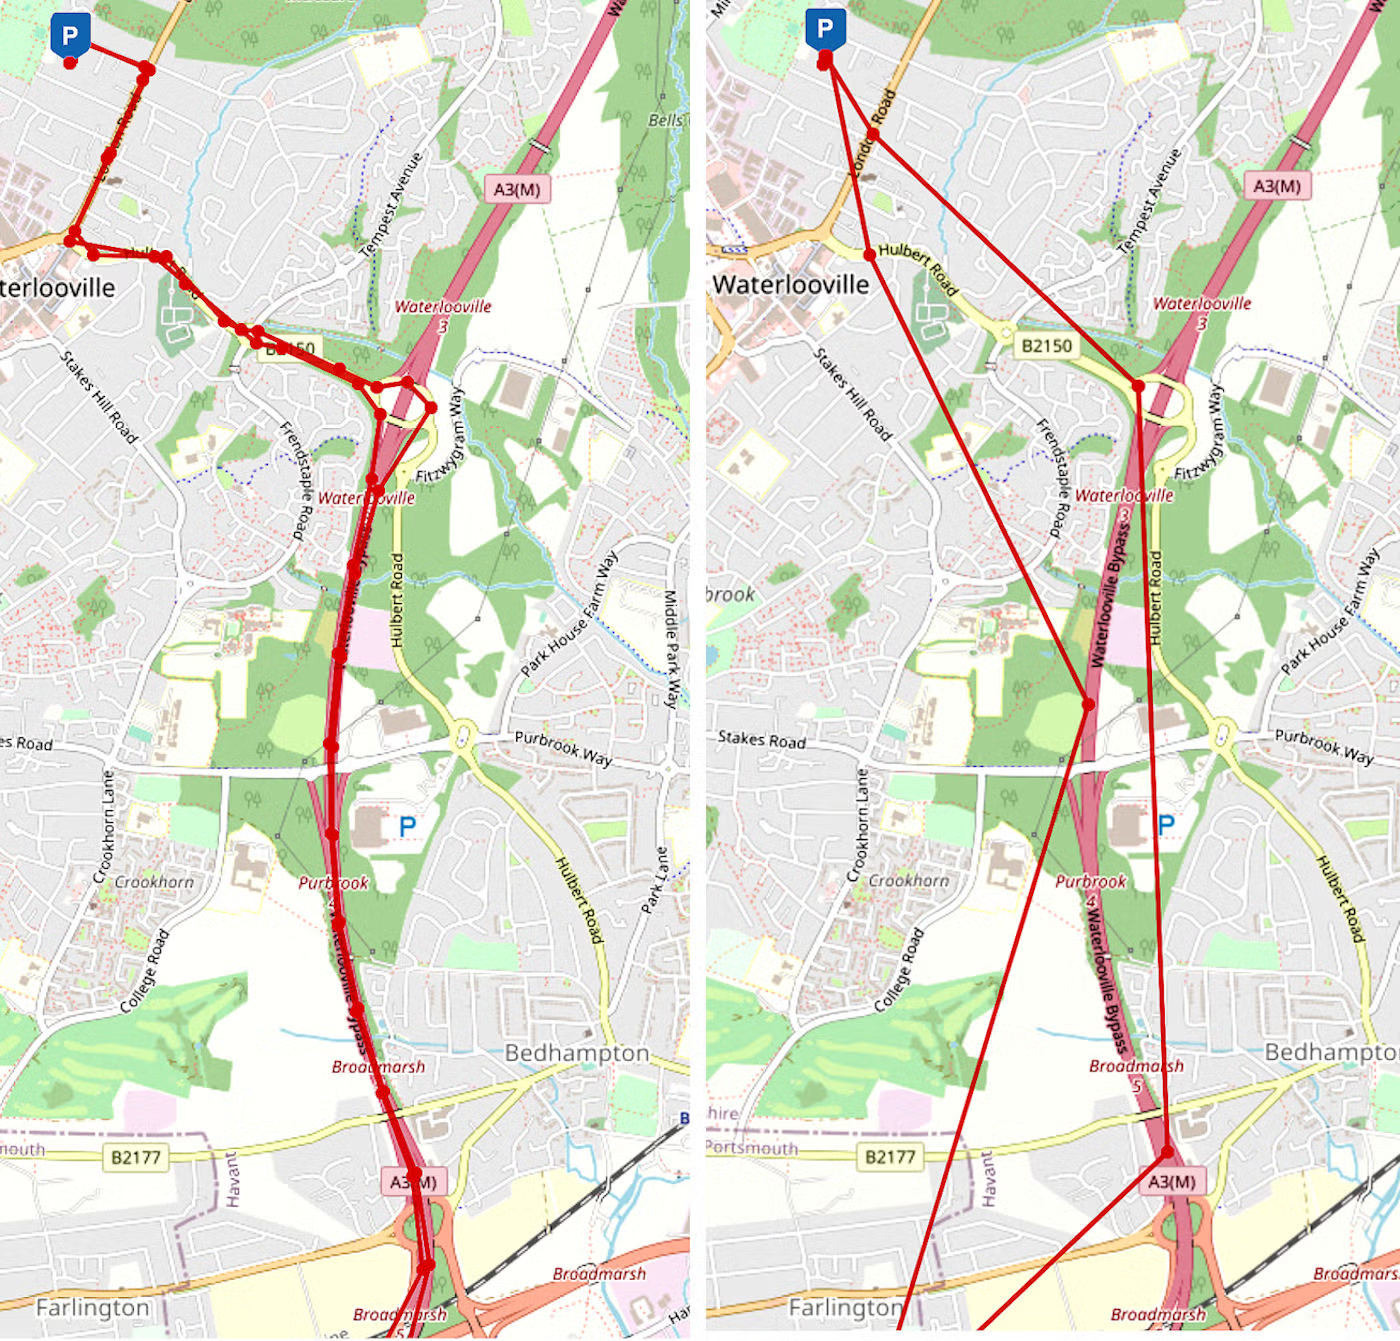
This is best demonstrated with the map below, where we sent a test vehicle on a short journey, fitted with both a standard OBD tracking device (upper map) and one of our professional units (lower map). At first glance the upper OBD plot is adequate — it shows the vehicle going and returning, and there is enough information to work out its probable route. Because it is time-based, the fix is more accurate when moving slowly, but as you can see (especially when leaving the car park on the left), it has large gaps between points on faster roads.
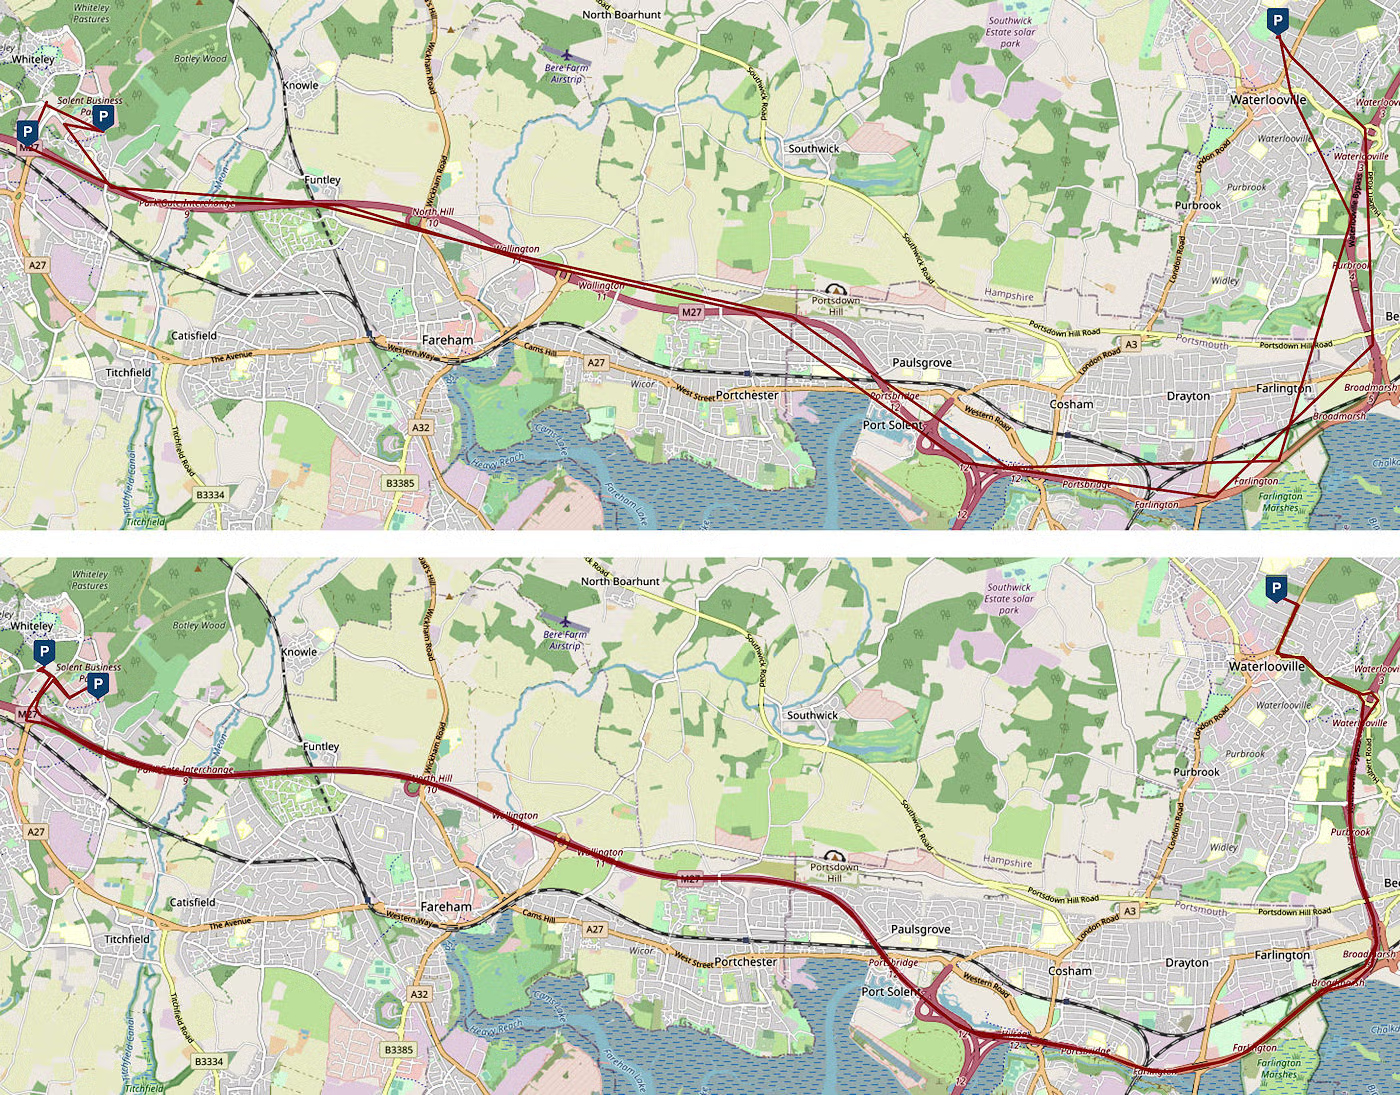
Once you zoom into an area, as we have done below, the difference is much more noticeable. It shows the standard unit on the right of the map and our professional one on the left. It's impossible to tell which of the two traces on the right is the "coming" and which is the "going" trace, whereas on the left you can easily see, on the roundabout, which one is which. Clicking on the round points will also show you the exact satellite-synchronised time the vehicle was at that point — useful, for example, when someone makes an allegation against the vehicle, so you can confirm it really was there at that time.
A More Detailed Example of an Event
At the beginning we mentioned setting an event to tell you when your man Fred was speeding, but let's now look a bit more at this powerful event tool for letting you know something has happened. We'll use a common example of a commercial RIB exceeding the 30-knot limit imposed by insurance companies. Please note, if you want basic instructions for setting up events and reports on speeding, there is a link above to a more detailed page just on that subject.
If you now go back to Settings (third icon at the top of the page – sliders, looks like a graphic equaliser) and select the "Events Tab" (1 in the image below), you will see a screen like the one on the left below. There may be a list of events if some have been set up already, but otherwise that part will be blank. Clicking on the plus sign in the bottom left-hand corner (2) will allow you to create an event, and brings up the "Event Properties" screen. Here you can give the event a name, switch it on or off, and select the type of event from the drop-down menu. In this example we have selected "Over-speed" and set it to 30kn. The next tab, "Objects", lets you say which object this event will apply to (hold down Ctrl to select multiple objects). The "Routes" tab allows you to select a pre-arranged route so the event can be triggered by a route variation, and "Zones" is the same, but tells you if someone strays into, or out of, a pre-arranged zone. The next tab, "Time", lets you configure when the event will be active, but by default it is 24/7. Note: your screens may look slightly different to these, depending on your version and package options.
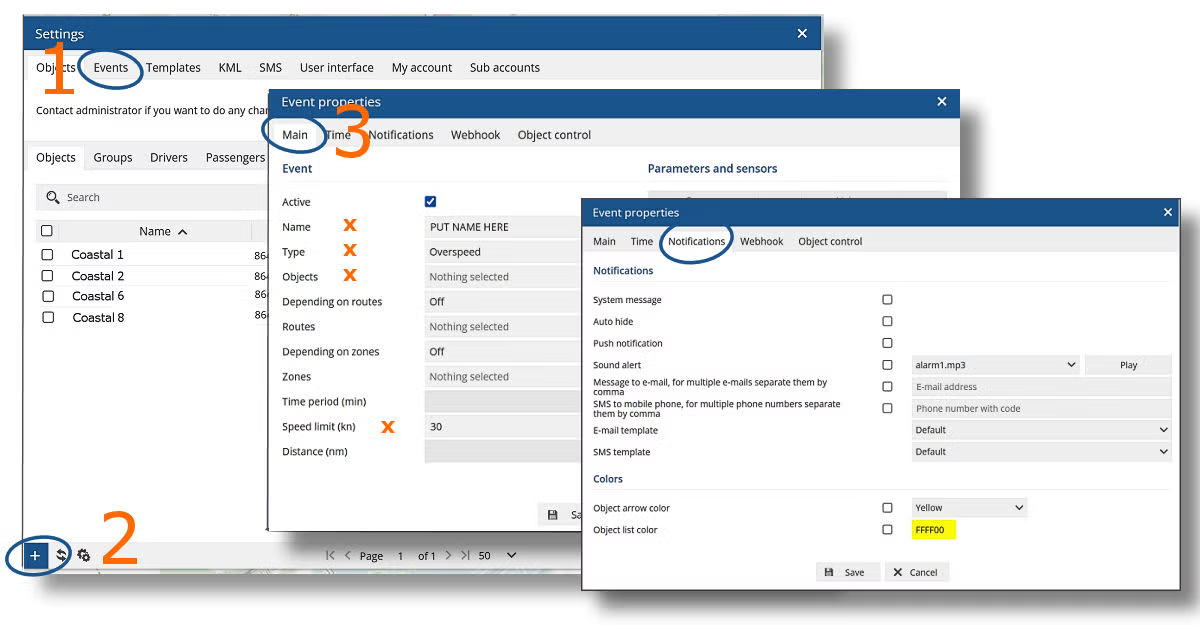
Clicking on the "Notification" tab will bring up the page above right, and it is here you determine what this event will trigger. The first option is to place a message on the screen, which you can also auto-hide after a few moments. You can play an alert if your computer has a sound system, and there are plenty to choose from. If you are on our standard monthly rate and have the extra modules to send an email, they can also be activated from here (charges will apply for SMS). With some systems you can even send a command to the object, perhaps triggering an event there. As with all of these screens, you must remember to click Save to keep any changes you make.
While we're talking about events, nearly all of the modern tracking devices we sell have the ability to tell you when something happens to the unit. Some are automatic — like when it moves, it tells you where it is, along with its speed and heading (marine versions). If you're prepared to do a little more work during installation, it's possible to get much more from your unit. When connecting the unit up for the first time you must supply power, both negative and positive. However, you will notice there are other wires labelled "IGN" or "DIN1" — these can be connected to external devices, but please check with us before you do it so we can confirm your idea will work. We'll deal with some examples of this below.
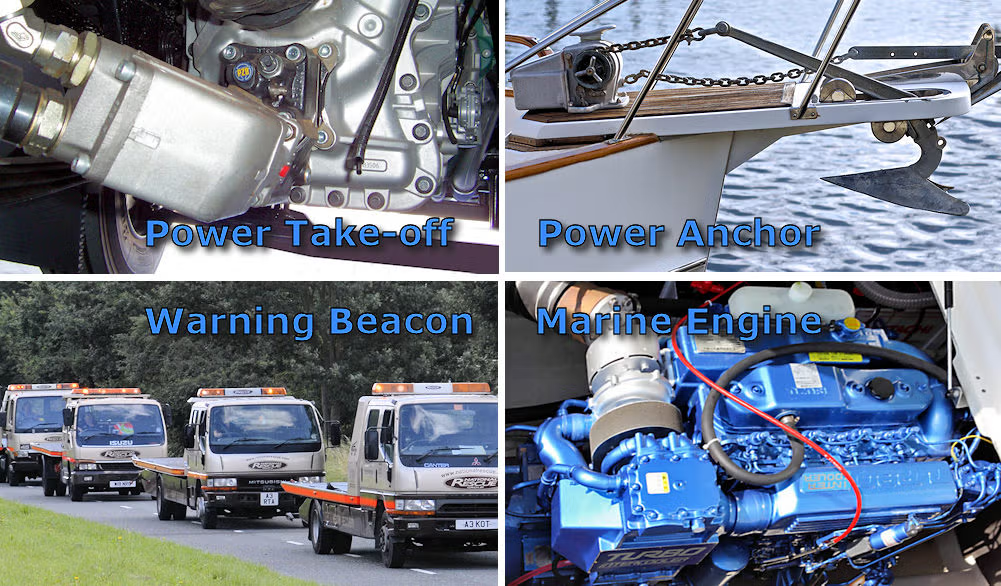
Above are shown a few examples of things you can connect to our tracking unit's extra wires. Normally you would pick up the live feed to the piece of equipment you want to monitor — this is fine as long as it is positive and between 10 and 30 volts. Let's start with the obvious one: an engine. All engines have an ignition feed that is live all the time the unit is running — find this and connect via a one-amp fuse. Another easy one is the PTO, as this will almost certainly have an obvious warning light, one side of which should go positive when switched on (if it's live all the time and the ground is what's switched, a relay will be needed). Warning: the status of these ports is piggy-backed on the location-fix transmission, so there will be a delay between the event happening and you being notified, equivalent to the fix update ratio (in simple terms, when the object is under way, notification will be considerably more frequent than when not moving).
The same is true of roof warning beacons and other hazard lights with a dashboard indicator. In the case of a power winch, it will be the "motor power feed" you are looking to pick up with your fuse. Warning: caution is needed in this area, as there will usually be two feeds (one for up/in and one for down/out). The simple option is to decide which one is important to you — for example, most recovery control room staff would only want to know when the winch is coming in, because this means the operative is loading, or has dropped off and is "stowing the kit". It is possible to get an indication on both, but you'll need to use two relays (talk to us — other customers have done it, and we know how).
Now that you have the unit sending you a notification that something has happened, you need to set up an "event" as shown in previous examples. Create the event with the plus sign on the Events Tab under Settings. Now give it a name, let's say "PTO in Use", and from the drop-down menu in "Type" select "Parameter". Then, under "Parameter Condition", select Digital Input one (di1) or ignition (ign). Note: different options will be offered depending on the age and type of tracking unit you are operating. What you have done is tell the system that when power is applied and the unit sends a message, this is what to look for.
On the next tab you can set times for this to apply — for example, midnight till 6am only, so that if you have wired it to the cab's interior light and it comes on during those times it will tell you the vehicle is being broken into, but will ignore that event during the day. The "Object" tab lets you decide which units are monitored for this effect, and lastly, as in the previous example, you need to select how you want to be informed using the "Notification" tab. This may just be a short message that pops up on the screen, or one that plays a sound as well, or it could be an email. Remember, not all customers have the email or SMS options, and in those cases it won't work until you activate it with us (charges apply for SMS).
The remaining Edit Object tabs are best left alone, at least until you get to grips with what we've covered so far — but if you feel you need to adjust something here urgently, please email our help desk for further instructions.
Installing a Tracking Device
Before reading our instructions here, please note there are also some helpful videos on tracker installation (along with other interesting items) on the Boat Track support page at boattrack.co.uk/support.html
Most people never stop to consider where the GPS satellites they hope to use with their tracker are located — in fact the main ones are some 12,500 miles, that's 20,000km, above us. Despite this, the installation of a quality tracking device is extremely straightforward, and nowhere is that more true than with most non-metal vessels. Motor vehicles, with the exception of fibreglass cars, and all metal boats, can be a little more difficult. So let's look at installation in more detail.
Non-metal vessels and vehicles
The simplest form of installation is to use one of our units with a built-in aerial, then gain access to the battery compartment and connect the "live wire" to the positive side of the battery and the "neutral wire" to the negative (or earth). Now cable-tie or Velcro the device down with the label side up, and in 95% of cases that's it — five minutes and the job is done. As long as the battery is between 9 and 30 volts (as low as 6 volts on some specialised models) and the compartment isn't screened with metal all round, this will work. Of course, the higher you can mount the unit the greater the range will be — so in a vehicle, behind the glove compartment (most are only held in with a couple of screws), or under the rear parcel shelf, are good spots.
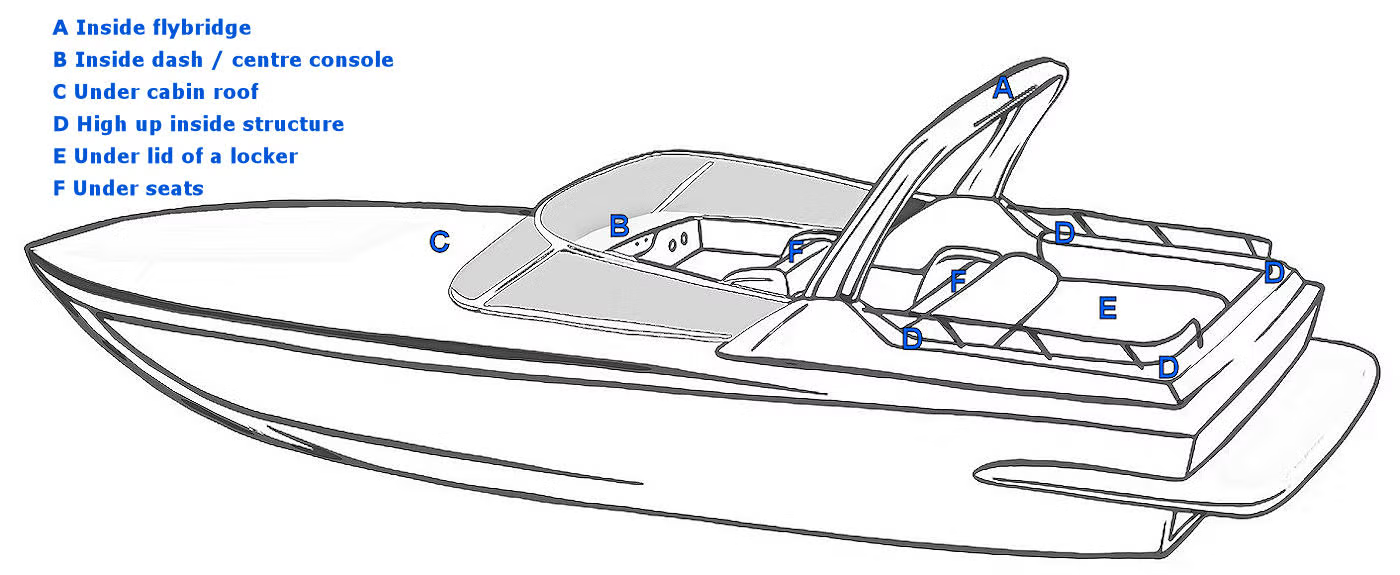
In the case of boats, the best locations are inside a fibreglass fly-bridge, or at the inside top of a control console or steering position, although to gain the height you may need to extend the wire to the unit — in which case, remember the unit's maximum current is less than an amp, so 2–5 amp cable is all you need (more about wiring below). Below are a few suggestions for installing a non-weatherproof tracker (or a covert installation of a weatherproof one) on a plastic/wood vessel, shown in order of best performance.
Metal vessels and vehicles
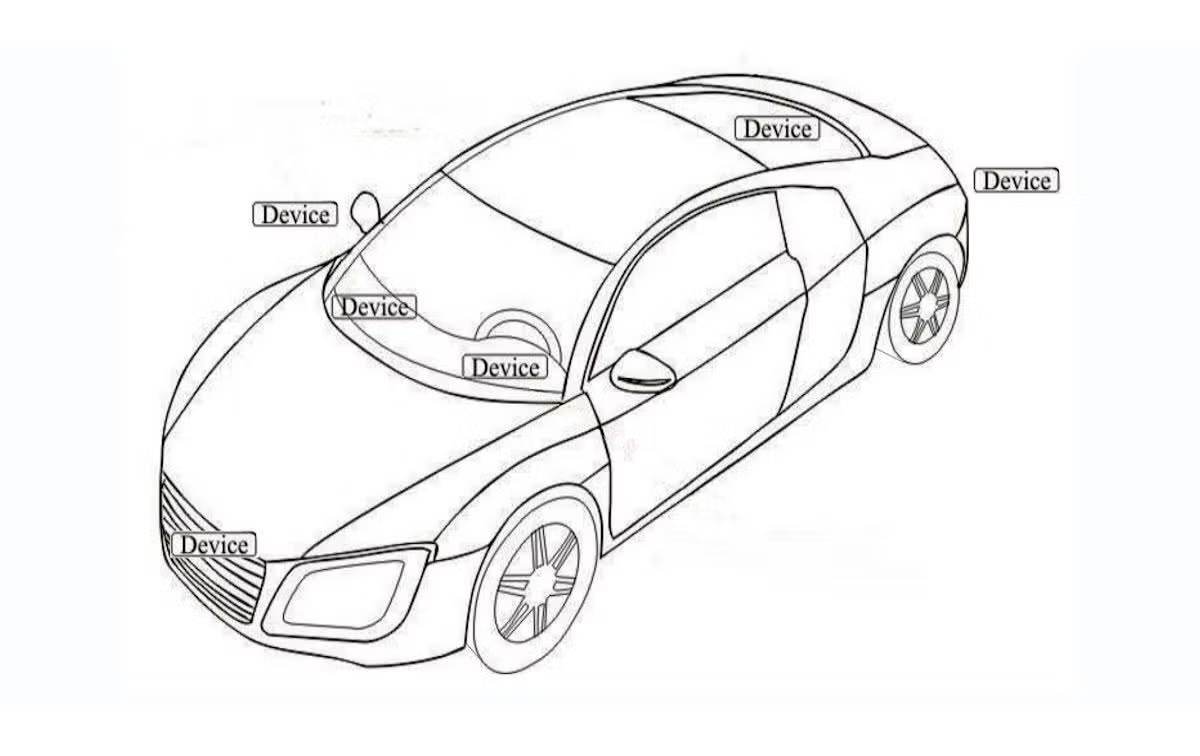
In the case of most motor vehicles, the windows are big enough for sufficient satellite signal to get through that the unit will work mounted inside the vehicle, behind the glove compartment (most are only held in with a couple of screws), or under the rear parcel shelf. Many vehicles have removable plastic trim between the rear of the bonnet and the windscreen that you can mount it under, but if you do that, seal it in a waterproof plastic bag or box.
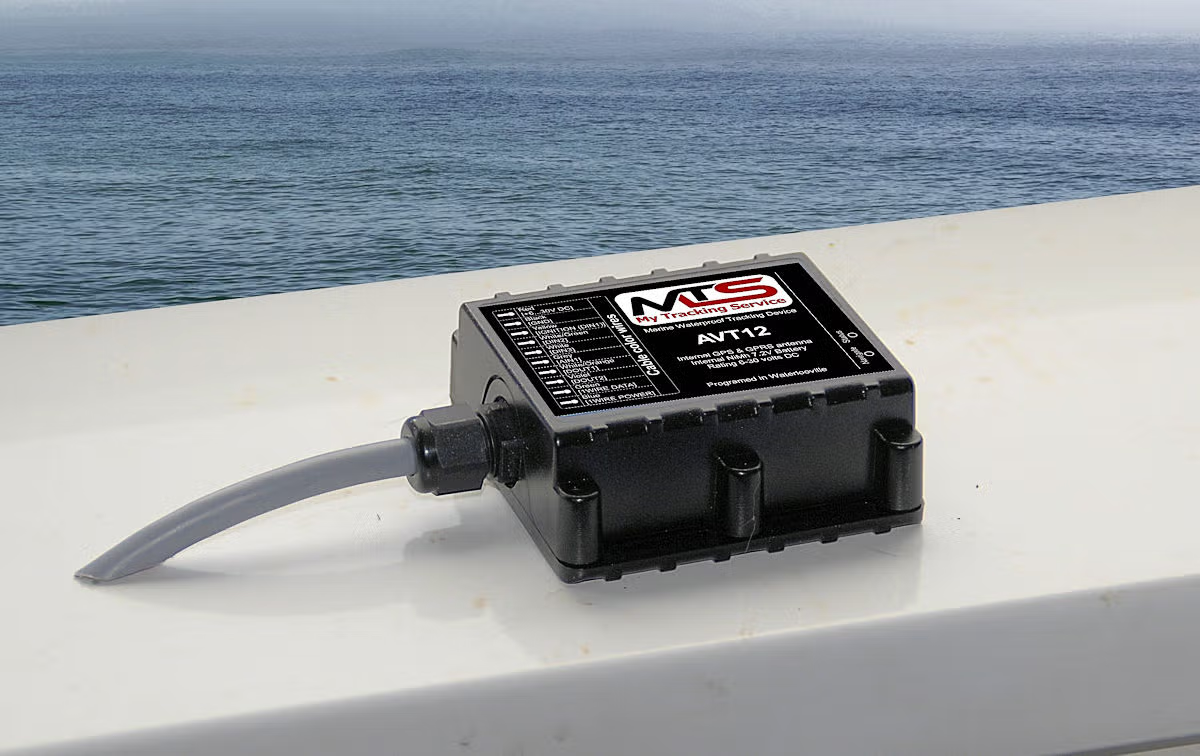
In the case of all-metal boats, the best option is to pay a bit more and get our weatherproof IP54 or IP67 version. With IP67, as long as it isn't submerged in water, it will mount almost anywhere outside (common sense says a sheltered position is best, of course). If you don't have a weatherproof tracker but still need to mount it outside, most ship's chandlers, or Amazon, sell small weatherproof boxes to house it, which you can mount on something metal and drill a small hole underneath to get the cable out (preferably with a drop of silicone to seal it).
Below you can see some of the places worth exploring on a motor vehicle, including plastic light cluster and mirror housings. There is also a picture of one of our weatherproof units mounted on a fly-bridge, out of the way of all but the worst waves.
Wiring
The first thing to consider is whether the point you're connecting to is fused. If it's straight on to the battery terminal, the answer is no! So, for a couple of pounds at the local motor factors or chandler's shop, why not put an in-line fuse (3–5 amps) between the device and the battery? With boats you may find there's a distribution board nearby with a spare fused terminal you can connect to (but make sure the fuse is 3–5 amps, not much bigger). The tracker only needs to be fused on the live side, but a fuse will protect you in the event that the wiring installation gets damaged one day — a blown fuse is better than a nasty fire.
In a motor vehicle, other places which may have an "always live" feed are the car radio or cigarette lighter socket. Often there will be an "always live" point in the boot for a tow bar, or even a cigarette lighter socket for running accessories like a cool box. Having found a suitable point to pick up power, you do need to check that the point you selected stays live when you turn the ignition off — in some modern vehicles this may not happen until you close and lock the doors, or even after a further 10–15 minutes when the main computer tells it to.
In some classic cars that are only used occasionally and aren't kept topped up with a smart battery charger — and also with some boats without shore power — you may not be able to use an "always on" supply for fear of completely flattening the battery. With a good battery this will typically be around 3–5 weeks, depending on capacity and state of charge. In these cases you'll need to think of a way to bring it on automatically when needed. With a boat you'll probably have a master switch, so you'll need to connect it to the switched side — the one that almost everything else is connected to, that goes live when you turn the switch to ON. With a motor vehicle, the best place is the "Acc" point on the key barrel, or on very old cars it will be labelled "Ign". Lastly, with all forms of transport, no battery likes to be left without a charge for long, regardless of whether you have a tracker or not. If this is you, see if you can rig a solar panel somewhere to keep it topped up — we have several customers whose vessels are on swinging moorings in estuaries who use this method year-round.
External connections
Lastly, let's look at external connections you can use to send a message to the map program. Most people won't bother with this, but all of our modern units have a digital input you can connect things to, so that the program is informed when they are on. Examples of where this option is used are: when the engine is running (ignition on); when lights (beacons, hazard, floodlight) are on; when bilge pumps come on, or the electric anchor is operated. Some commercial vehicle customers may want to know when the PTO or an on-board fridge is operating. This is usually the yellow wire, but we suggest checking with us before you use any of these options.
Warning: as you can see, there is an incredible amount of options to notify you of events, and a large number of reports you can produce — but remember, all the information used is sent to you via a radio network and the internet. This means it should work 99% of the time. However, as we all know, "Sod's Law" dictates that instances of failure increase in direct proportion to the importance of the message. In simple terms, this is not a security system, and although it can complement security, it does not replace common sense and a good alarm.
Backup Your Data (Important) and Exporting CSV Files
The map program automatically backs up your data and stores it for up to three months, allowing you to quickly look at where you have been during that time. For most people (especially casual sailors) this will be more than enough. If, however, you are running a charter operation, or any other form of commercial operation, you may feel it's not long enough. As you can imagine, monitoring hundreds of boats transmitting sometimes every minute, every day, for three months, takes up a lot of expensive data storage — so it's not something we can realistically offer for longer than the existing three months. To solve this problem, we've given you the option to back up your data and store it on your own computer.
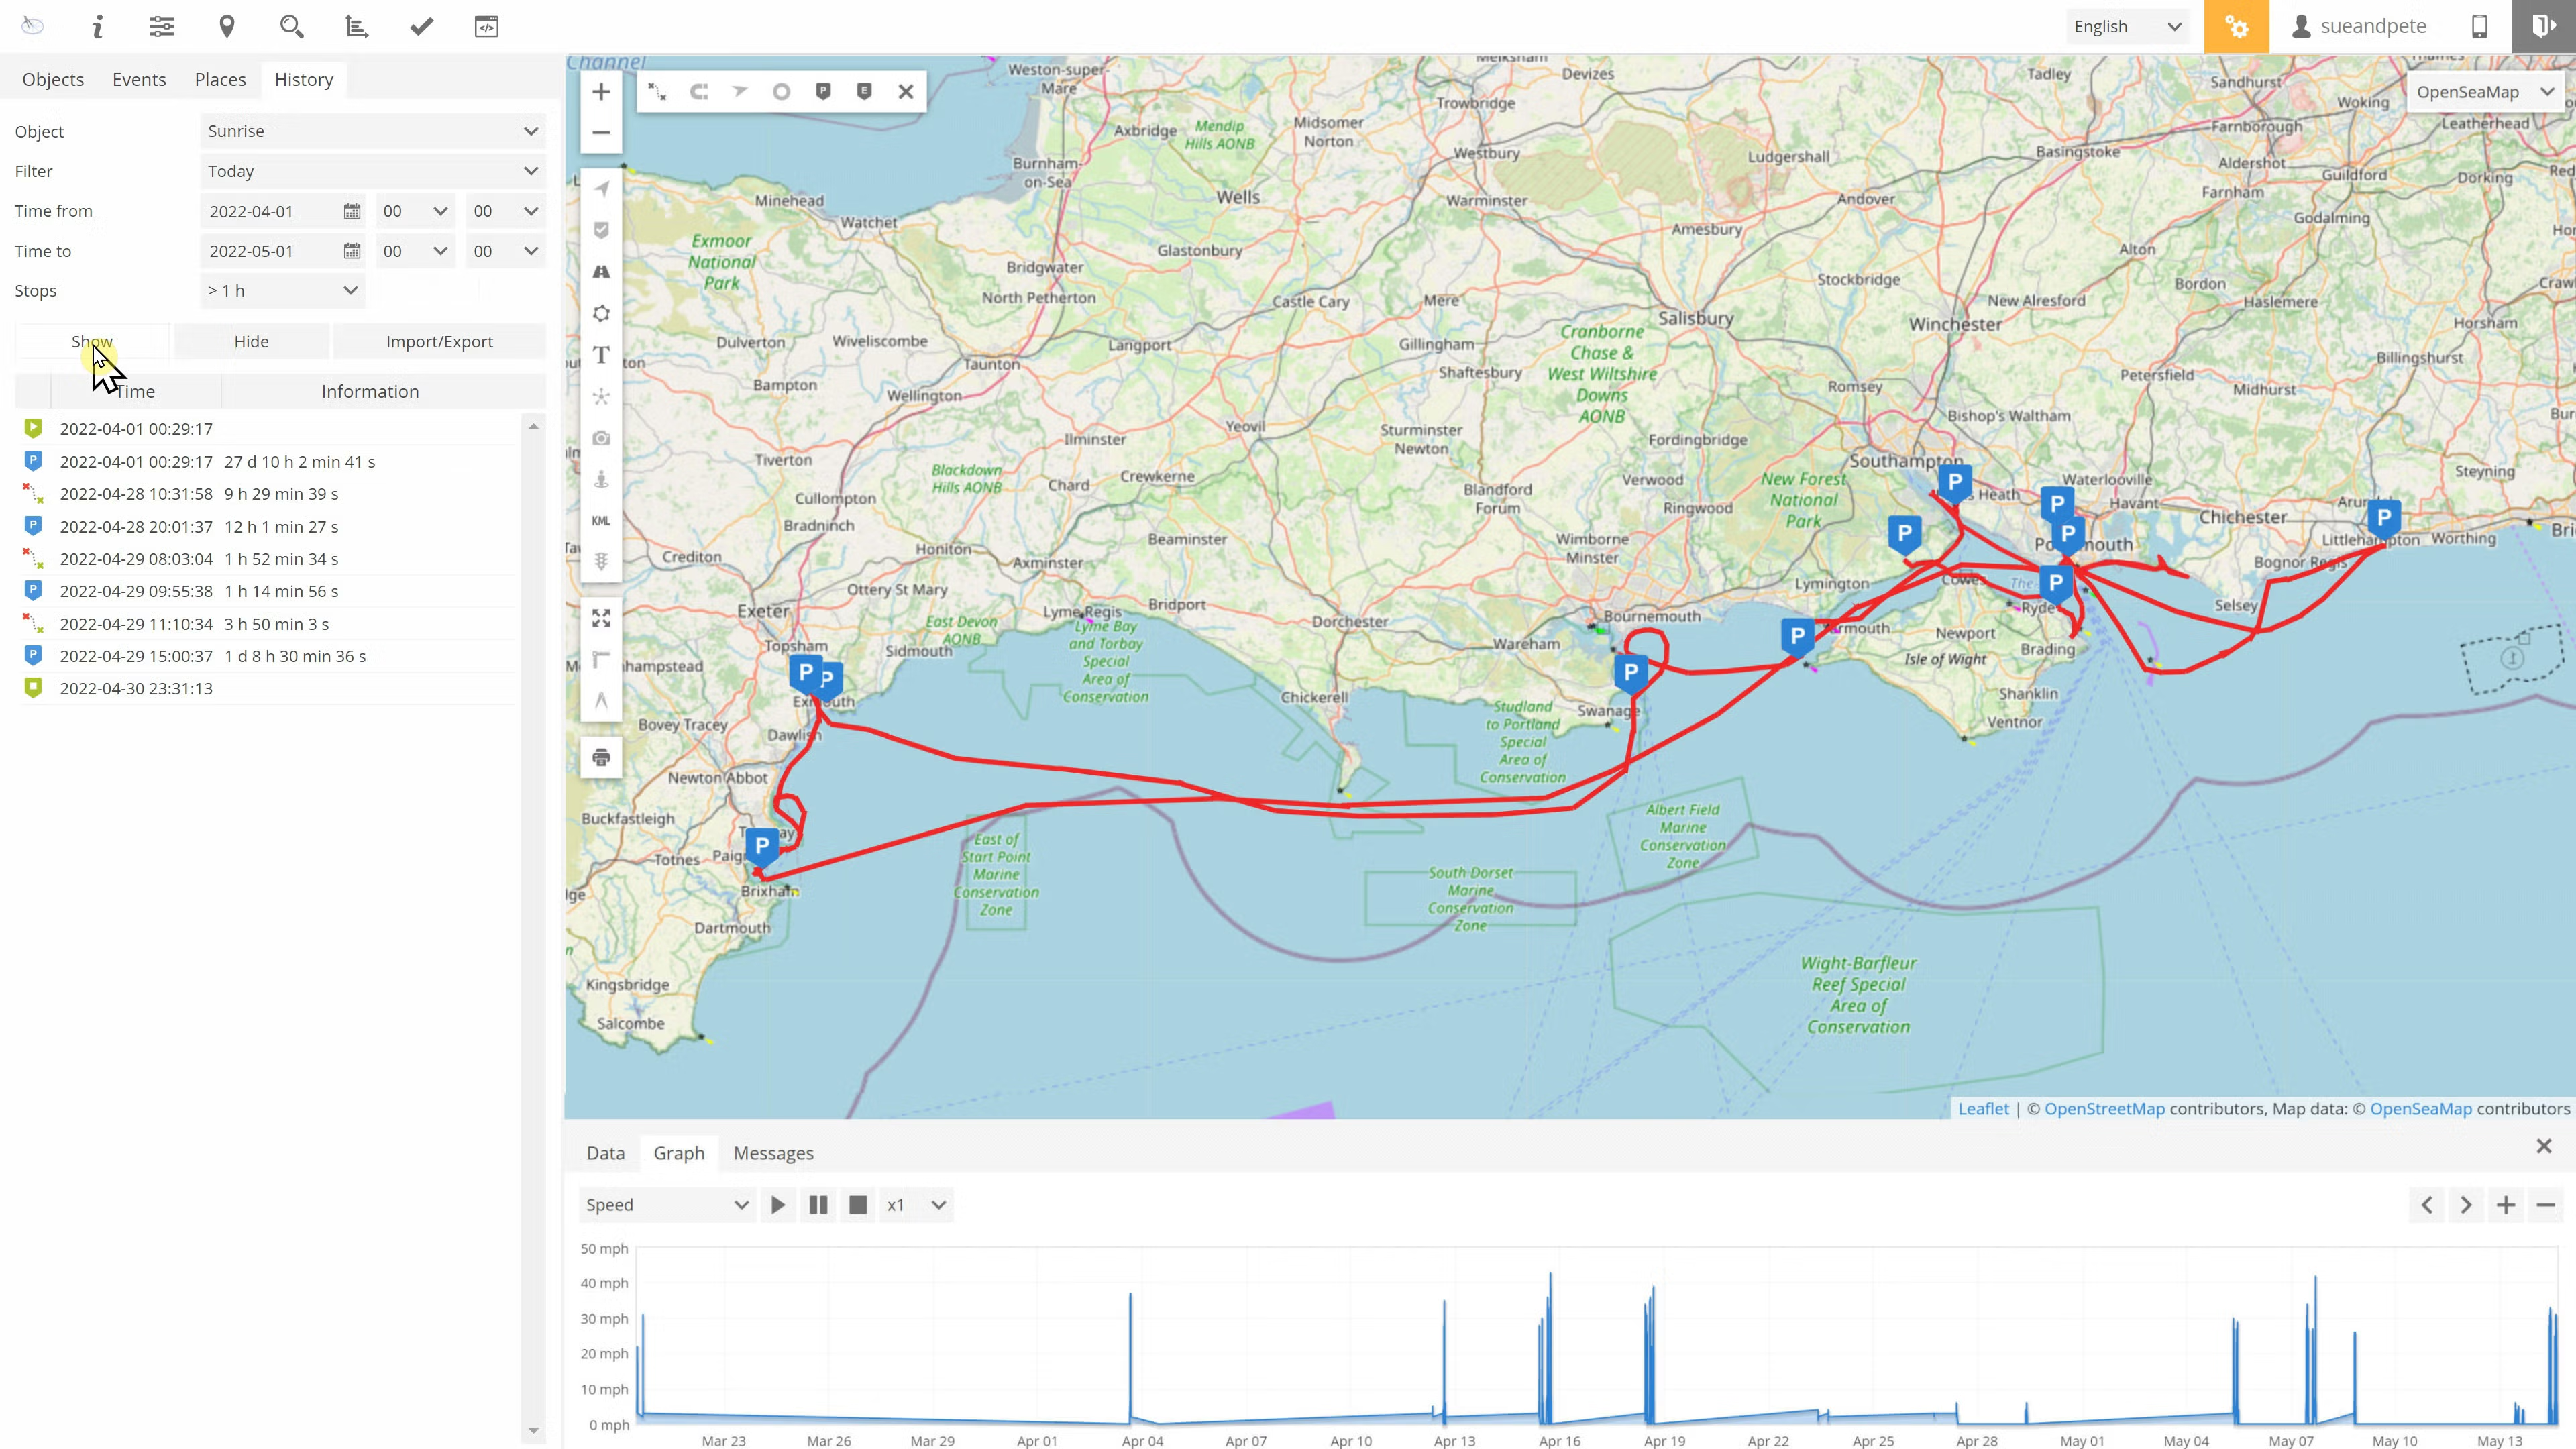
In the example above, we have created a report for the vessel we want to save, for trips over a month, in the normal way. This is best done by selecting the start and finish dates on the left screen and then selecting Show. The resulting report can then be saved locally by going to the Export tab (as shown below) and selecting the GSR format. You then select where you will store it on your computer and select Save. Once you have done that, at any time in the future you want to access that information, you just go into Reports, select the Import tab, and load that saved GSR file. This will then display again just as it did before. There is also a video showing you how to do this step by step on our website's support page.
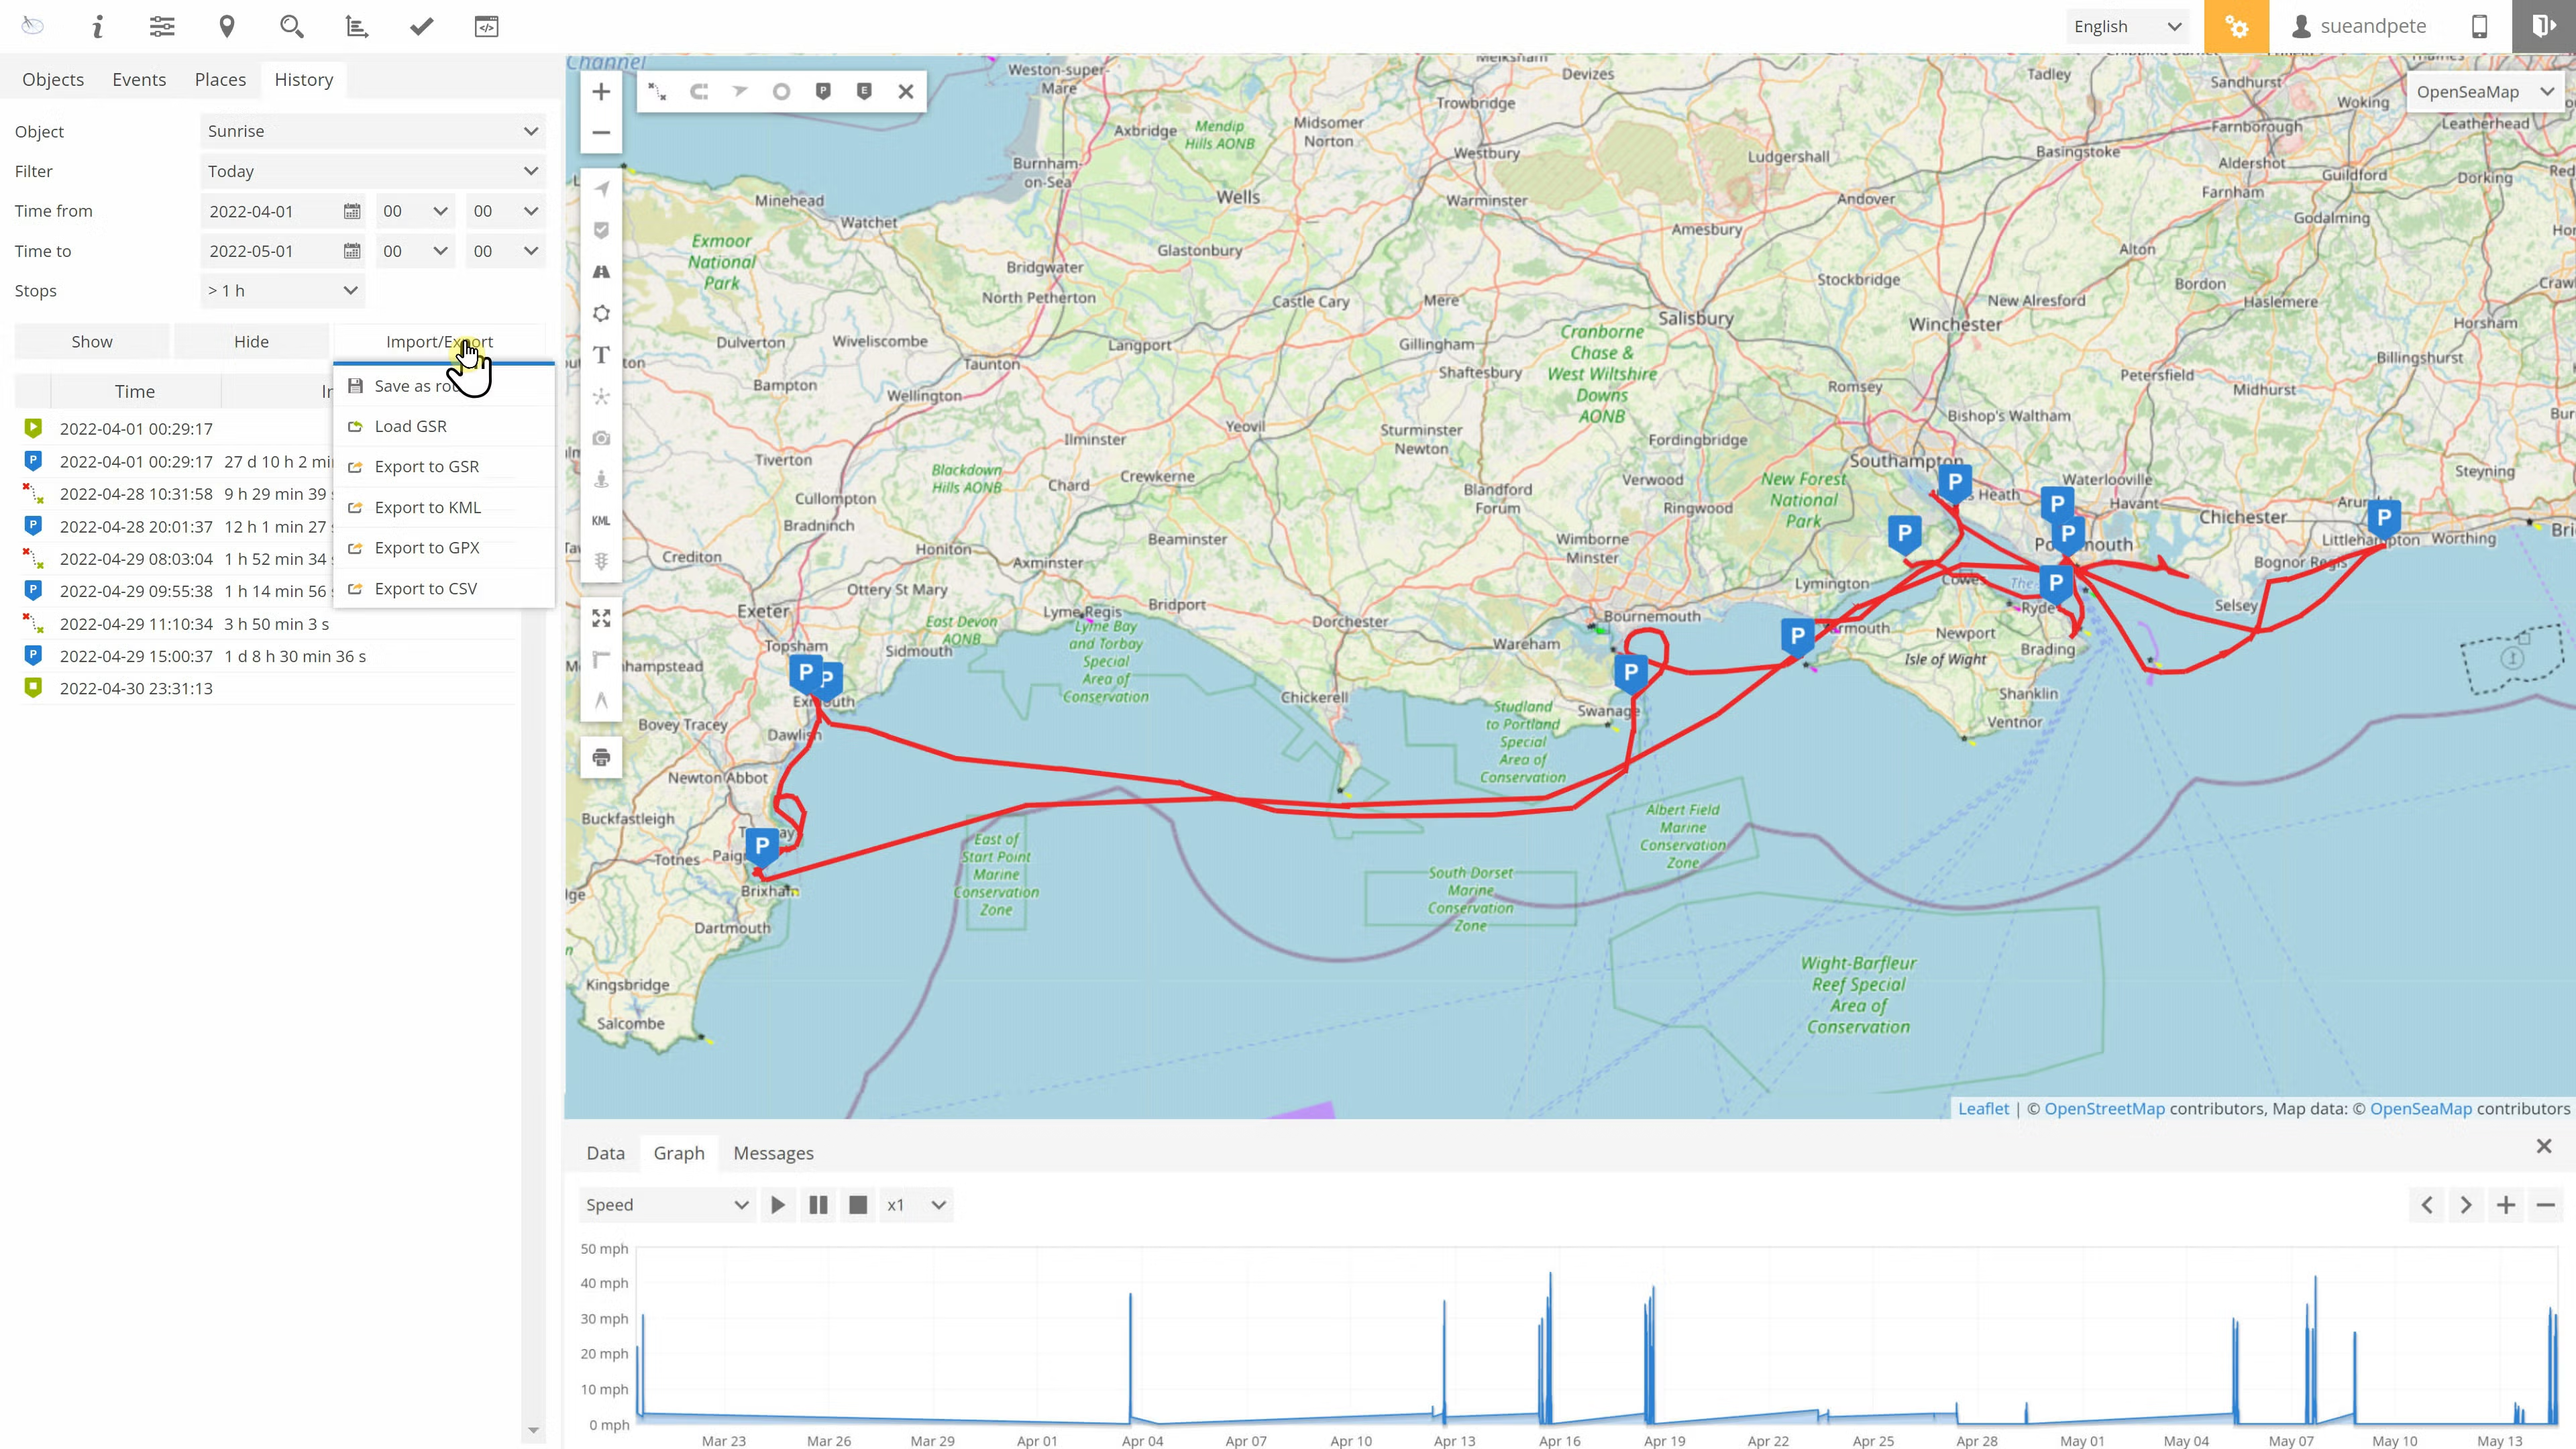
You can also use these reports for analysis by saving them as CSV files, which can then be fed into analytical programs or produce spreadsheets. You will find, however, that if you open them with MS Excel, all the parameter columns are joined as one! If you wish to make them individual, don't open in Excel — first open in a text editor like MS Notepad, or the excellent Helios Textpad. Then use "search and replace" to remove quotation marks (") and replace with a space (see image below). Now save the file, and it will read normally in spreadsheets like Excel.

Reporting on Over Speed
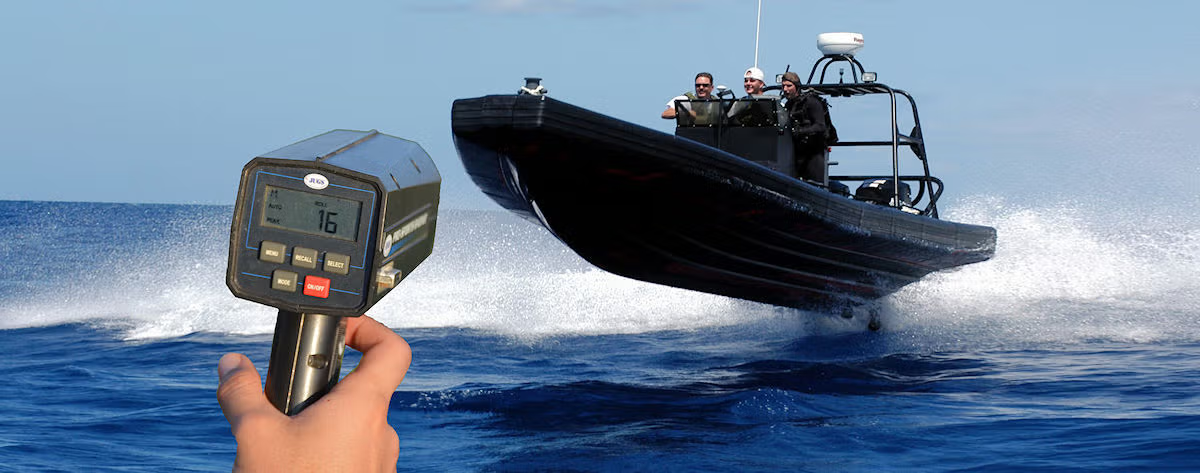
The most common report all our MTS / Boat Track customers are interested in is reporting speed. This isn't always the boss of a haulage company wondering why a driver with an urgent delivery is only doing 40mph on a motorway, or a charter hire company wondering why their RIB is doing 40 knots through Poole Harbour — sometimes it's because an insurance company has put a restriction on equipment use. We will attempt here to give you some suggestions on the best way to use reports for speed; it doesn't matter if your GPS tracker is being used in a car, truck, RIB, or other vessel, the principle is the same.
However, just before we do that, please remember that the information any reports are based on comes from a mobile source using radio and internet pathways, sometimes under difficult conditions. Therefore, users must accept that although these are a very good guide to what has happened, there can be slight inaccuracies, and this must be factored in before making any decisions.
Later we will look at detecting speed events as they happen, but let's start by making a simple Speed Graph for running after the event. This is achieved by going to Reports (top of map screen on a PC, looking like a spreadsheet, or a graph with two arrows), shown as red number 1 below; the report screen (red 2 below) will open. Now click on the plus sign at red 3 to create a blank report.
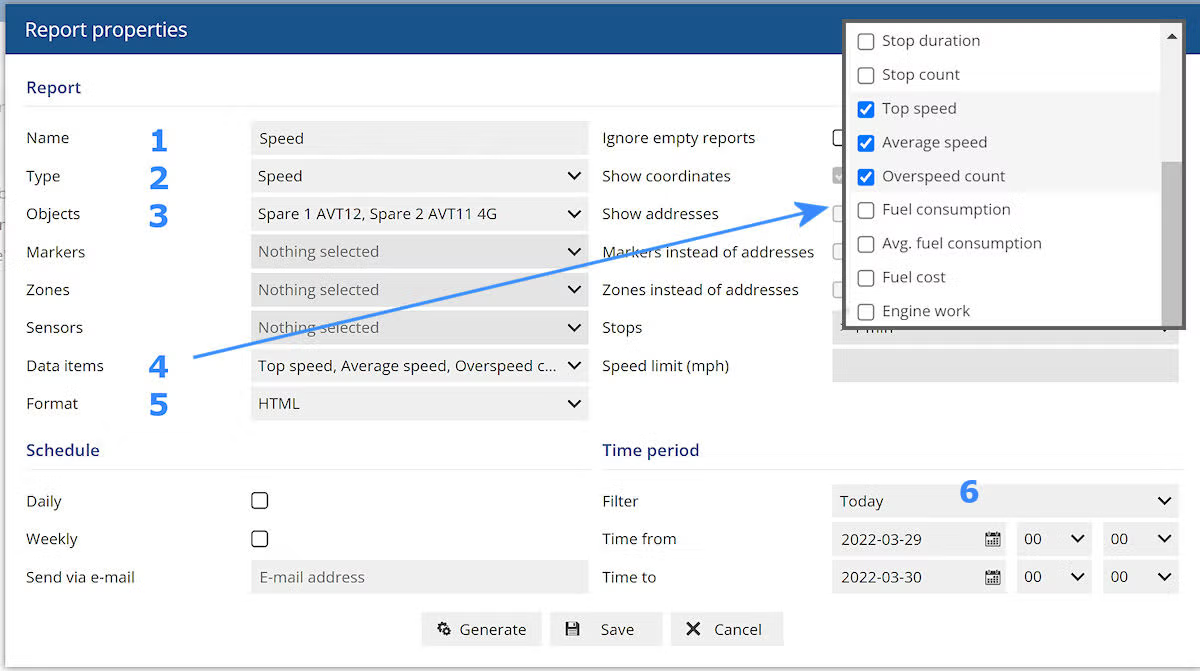
We now need to fill out the page: first, give the report a name (blue 1 below), then, using the drop-down arrow, select the type of report — in this case select "Speed", which is in the "Graphical Reports" sub-section. Next select an object, or even more than one, and then select the drop-down at Data Items (blue 4 below). This will give you a lot of choices, but just tick the three items shown for now. Next you can select what format you want the report in (PDF, HTML, etc.) and then, lastly, the "Time Period" (blue 6) — we are using "Today" here. You can now click Generate and the report will be produced and saved by default in your computer's default download directory (most browsers will display it in the bottom left-hand corner of the browser).
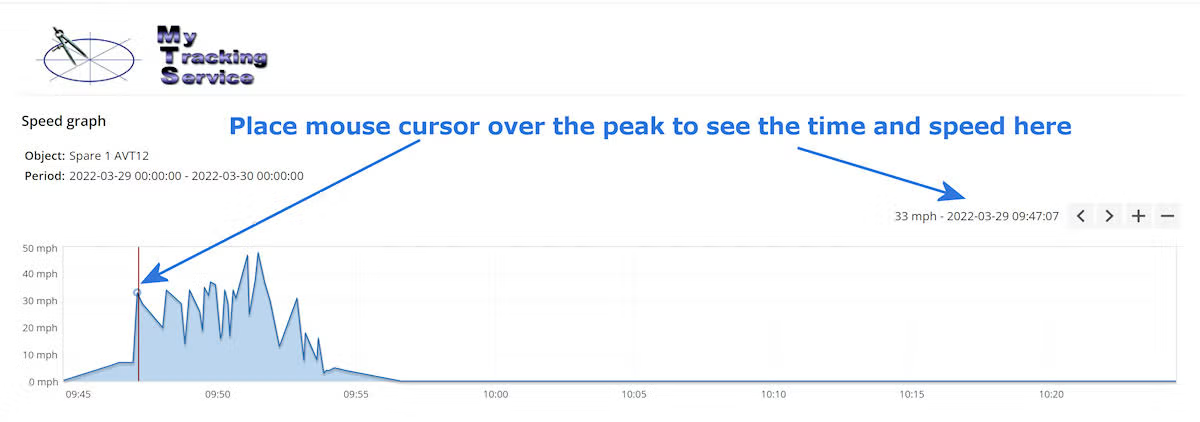
Below is the result of that report, and it will show the whole day, so you may need to zoom in with the + and – buttons and slide along the timeline with the < and > keys. To see details of the peaks, just place your mouse pointer over them.
We suggest you now save this first report and then start another the same, but this time experiment with the data field options shown and the timing of the reports to see what else you can do. Having saved a report, you'll see it's now shown on the list, and clicking on the gears (red 4) will generate it again. Clicking on the pencil will let you edit it, and the bin will delete it. You can see the report again in the "Generated" section of Reports (see red 5 above, which has nothing to do with Star Wars), and here clicking on the folder will let you review it.
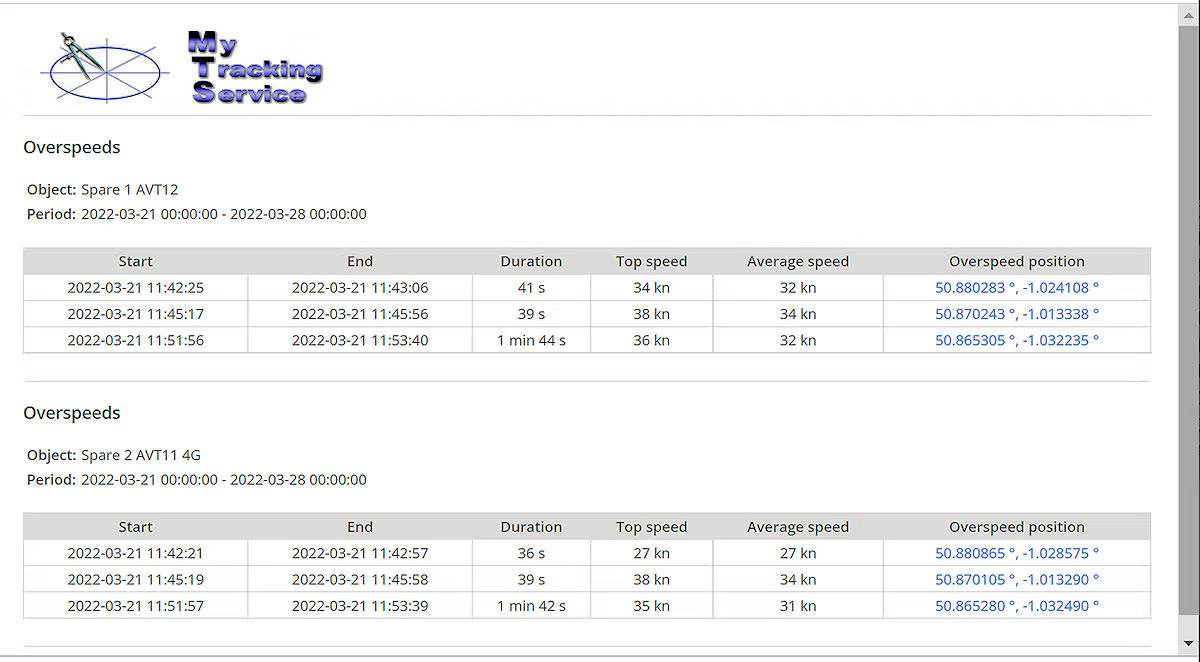
Now let's create another speed report — this time we'll give it a different name and select "Over speed" from the "Type" drop-down menu. Next, select some or all of the objects you want the report on. In Data Items, select what you think you'll want included in the report, select the speed limit (in this case 25 knots), and lastly, for Time Period select "Last week" (assuming you have data for last week and aren't a new user). Now generate the report.
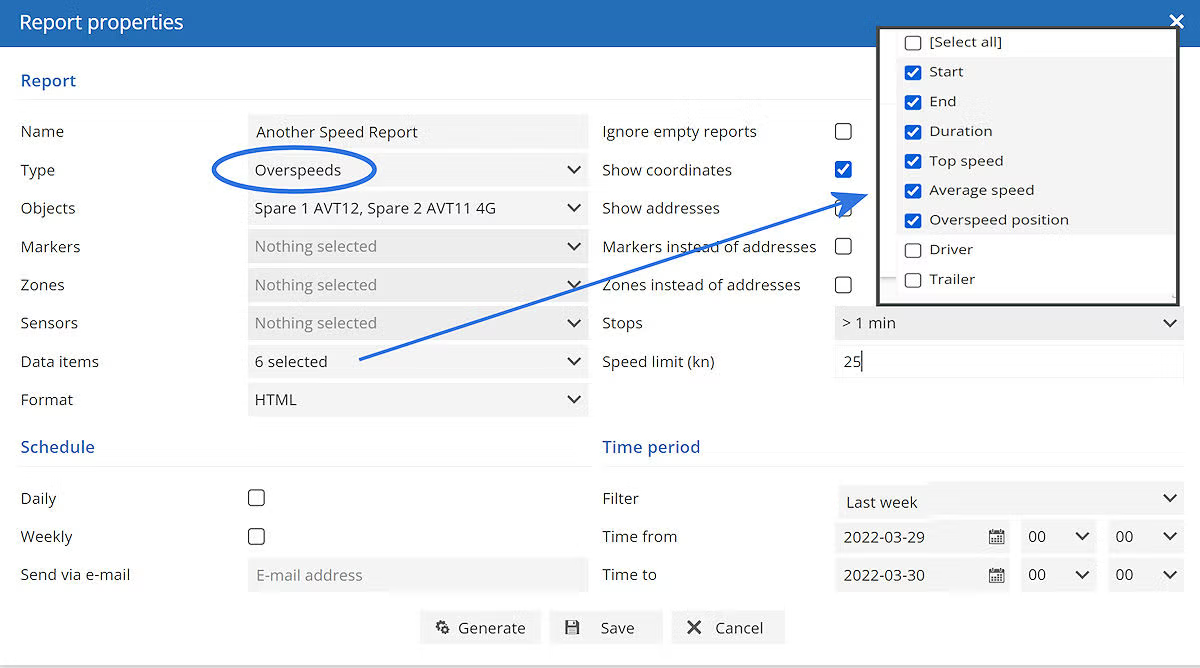
In the case above, this is the report you get: in the first case, with AVT12, you can see it was only used on the one day, and on 3 occasions broke the speed limit of 25 knots. You can also see how long for, and where — clicking on those coordinates will show you the location on the map.
Speed Warnings
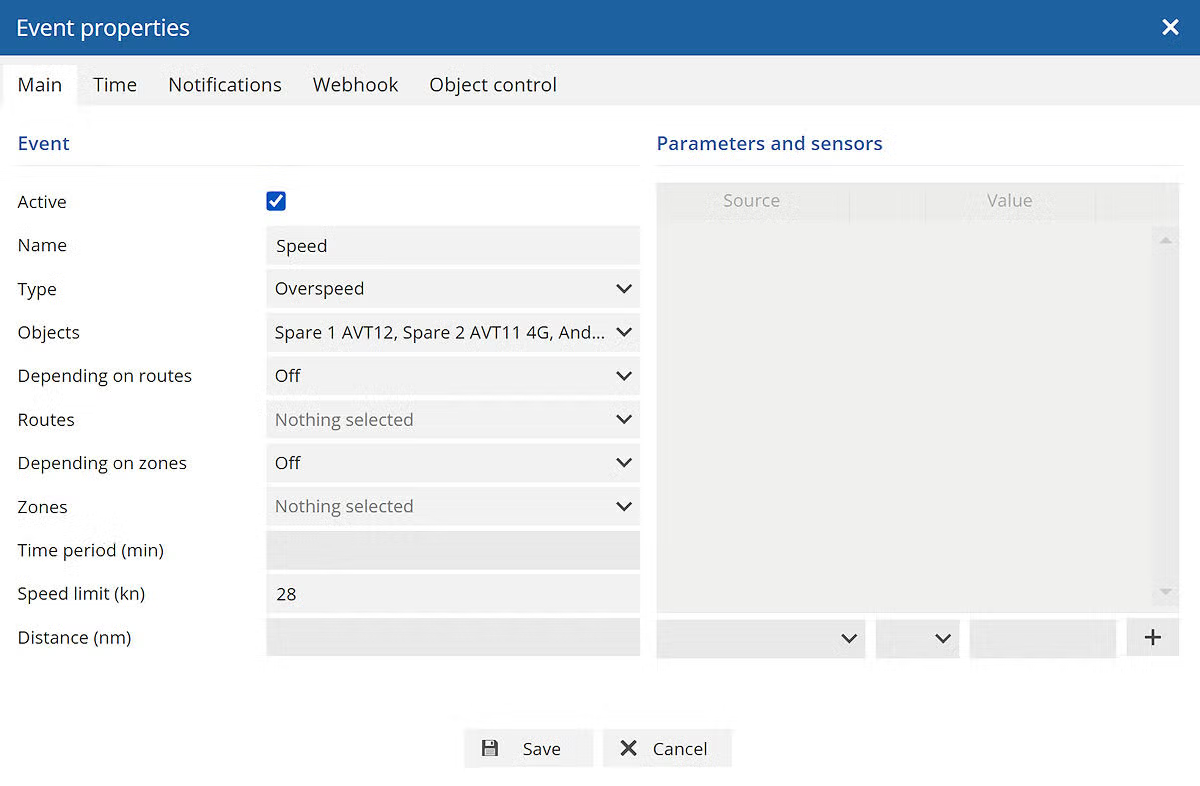
So far we've been looking at speeding after the event; it's also possible to use the system to warn you just after it has happened, and to select from a range of reactions. To do this, go to Settings (top left, next to the "i" for Help tab, and looks like a small graphic equaliser) and select "Events". Ignore any events already in there and click on the plus (+) sign to create a new one. As you can see below, there are a lot of options, some of which will only work depending on what other options you select.
The first, "Active", lets you switch saved events on and off; next to this is a box to add a name for the event. The "Type" box is again a drop-down, so please select "Over speed" and, in "Objects", select the objects you want it to apply to. Now click on Notifications and go to the screen below.
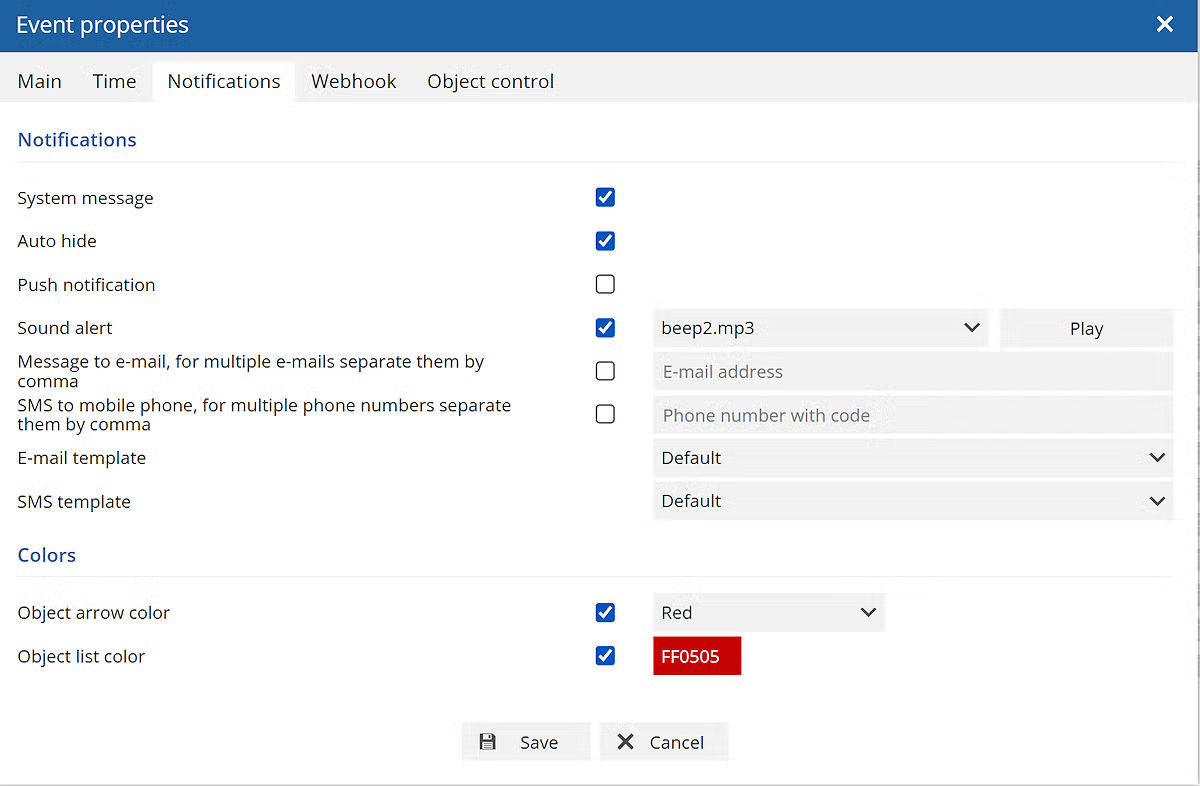
When you have clicked on "Notifications" you will be presented with a blank screen similar to the one below. Ticking the "System message" box will cause a message to appear on the program screen, telling you who and when the event was triggered. This can be disconcerting and fill the screen with messages, so we suggest you also select "Auto hide" to get rid of the message after a few seconds. If you want the event to make a noise, select a suitable sound file, and if you want to also send an email (and have set up a server to do this), you can also do this here. This is sufficient for now, but don't forget to save it!
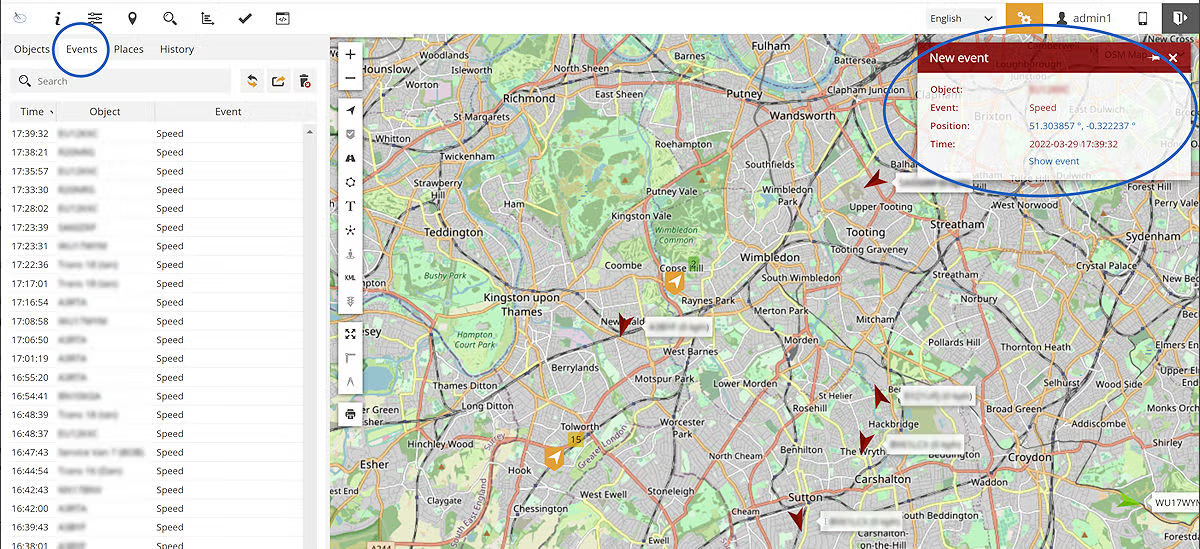
This should give you a good start on both Reports and Events, and although it has been speed we've been talking about, there are other options you can experiment with. Lastly, be aware that events triggered by the above method will exist for some time under the Event tag (between Objects and History on the main PC screen, outlined below in blue) — click there to see if anyone has been speeding recently. The example below shows one of our fleet operators, where we set the event to trigger at 35mph, and it also shows the warning message displaying.
Notes: in the examples here we've used MPH and knots, but the report will handle both, along with kilometres, and will default to whatever you have set the software to in the "User Interface".
"I am always ready to learn, although I do not always like being taught."
Winston Churchill
Copyright © 2008–2026 · All Rights Reserved ·
Return to
My Tracking Service or
Boat Track